Measure engineering effort with a new FTE-based model [beta]
Improving engineering effectiveness starts with understanding how time is spent across the organization and finding better ways to use it. By analyzing cycle time, project scope, and activity over time, you can gain valuable insights that help you plan work better and improve focus. Today, we’re introducing an even more comprehensive way to measure engineering effort across your projects.
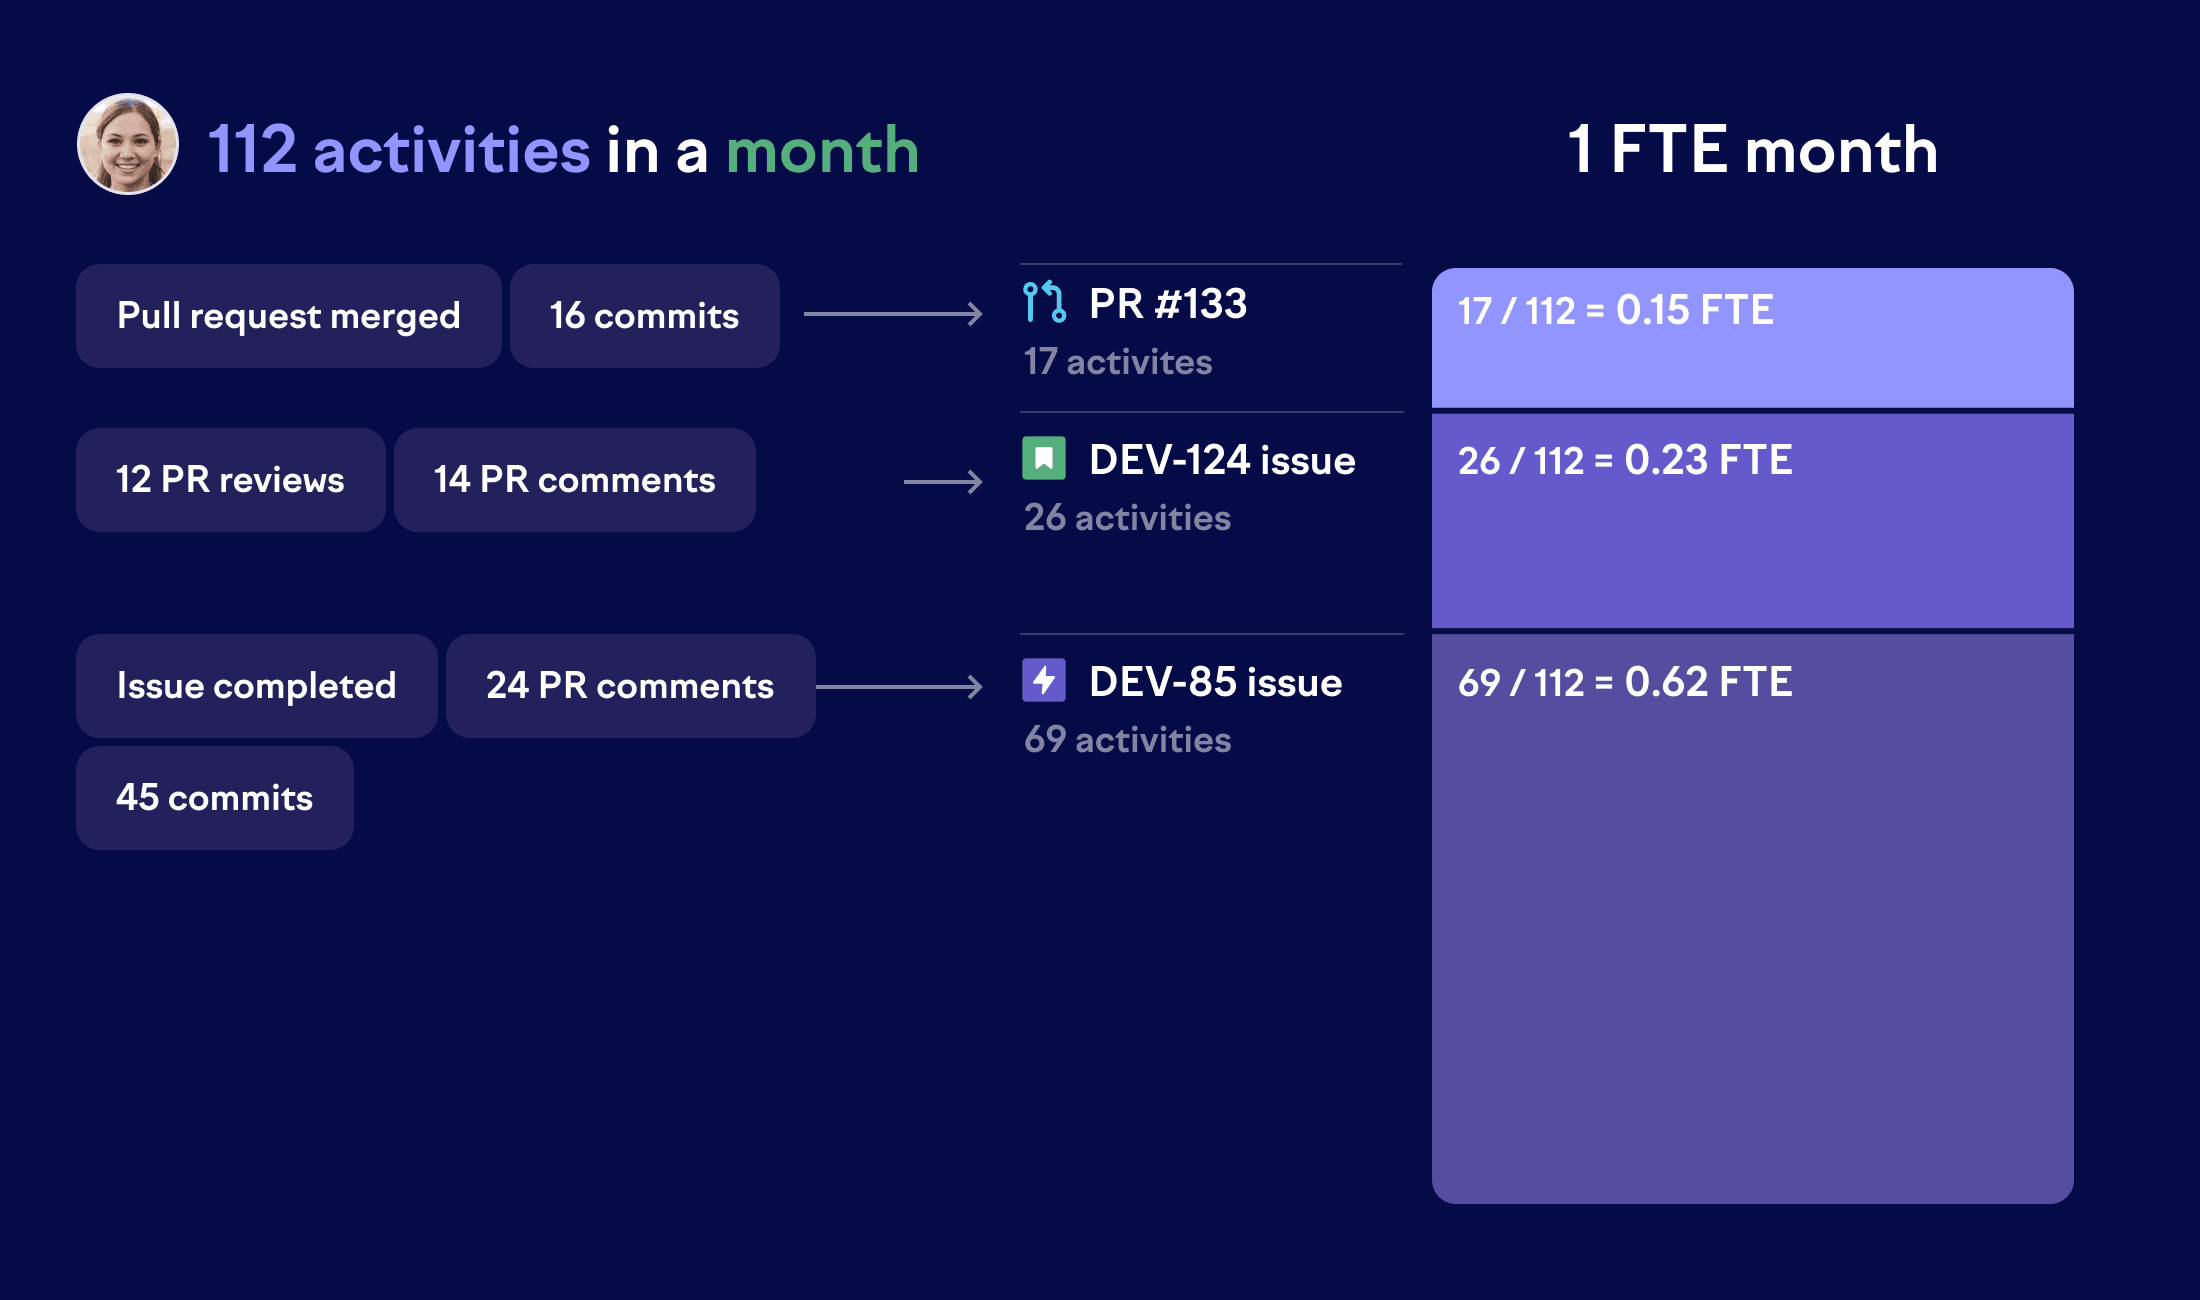
The new model measures effort in full-time equivalent (FTE) months. To model effort, we analyze each developer’s activity timeline to evaluate where their time is spent across various activities, such as:
Coding contributions
Completed issues
Pull request activities like reviews and comments
Each developer is allocated one FTE month per month, which is then distributed across the issues and pull requests they contributed to. This data is aggregated to provide an estimate of the total effort spent on stories, epics, and initiatives.
The advantage of this approach is that it considers hundreds of data points for each developer and accounts for different coding styles. In other words, it doesn’t matter whether you prefer many small commits or fewer, larger ones. Effort modeling is best seen as a complement to activity-based views, offering an additional perspective for comparing effort across projects.
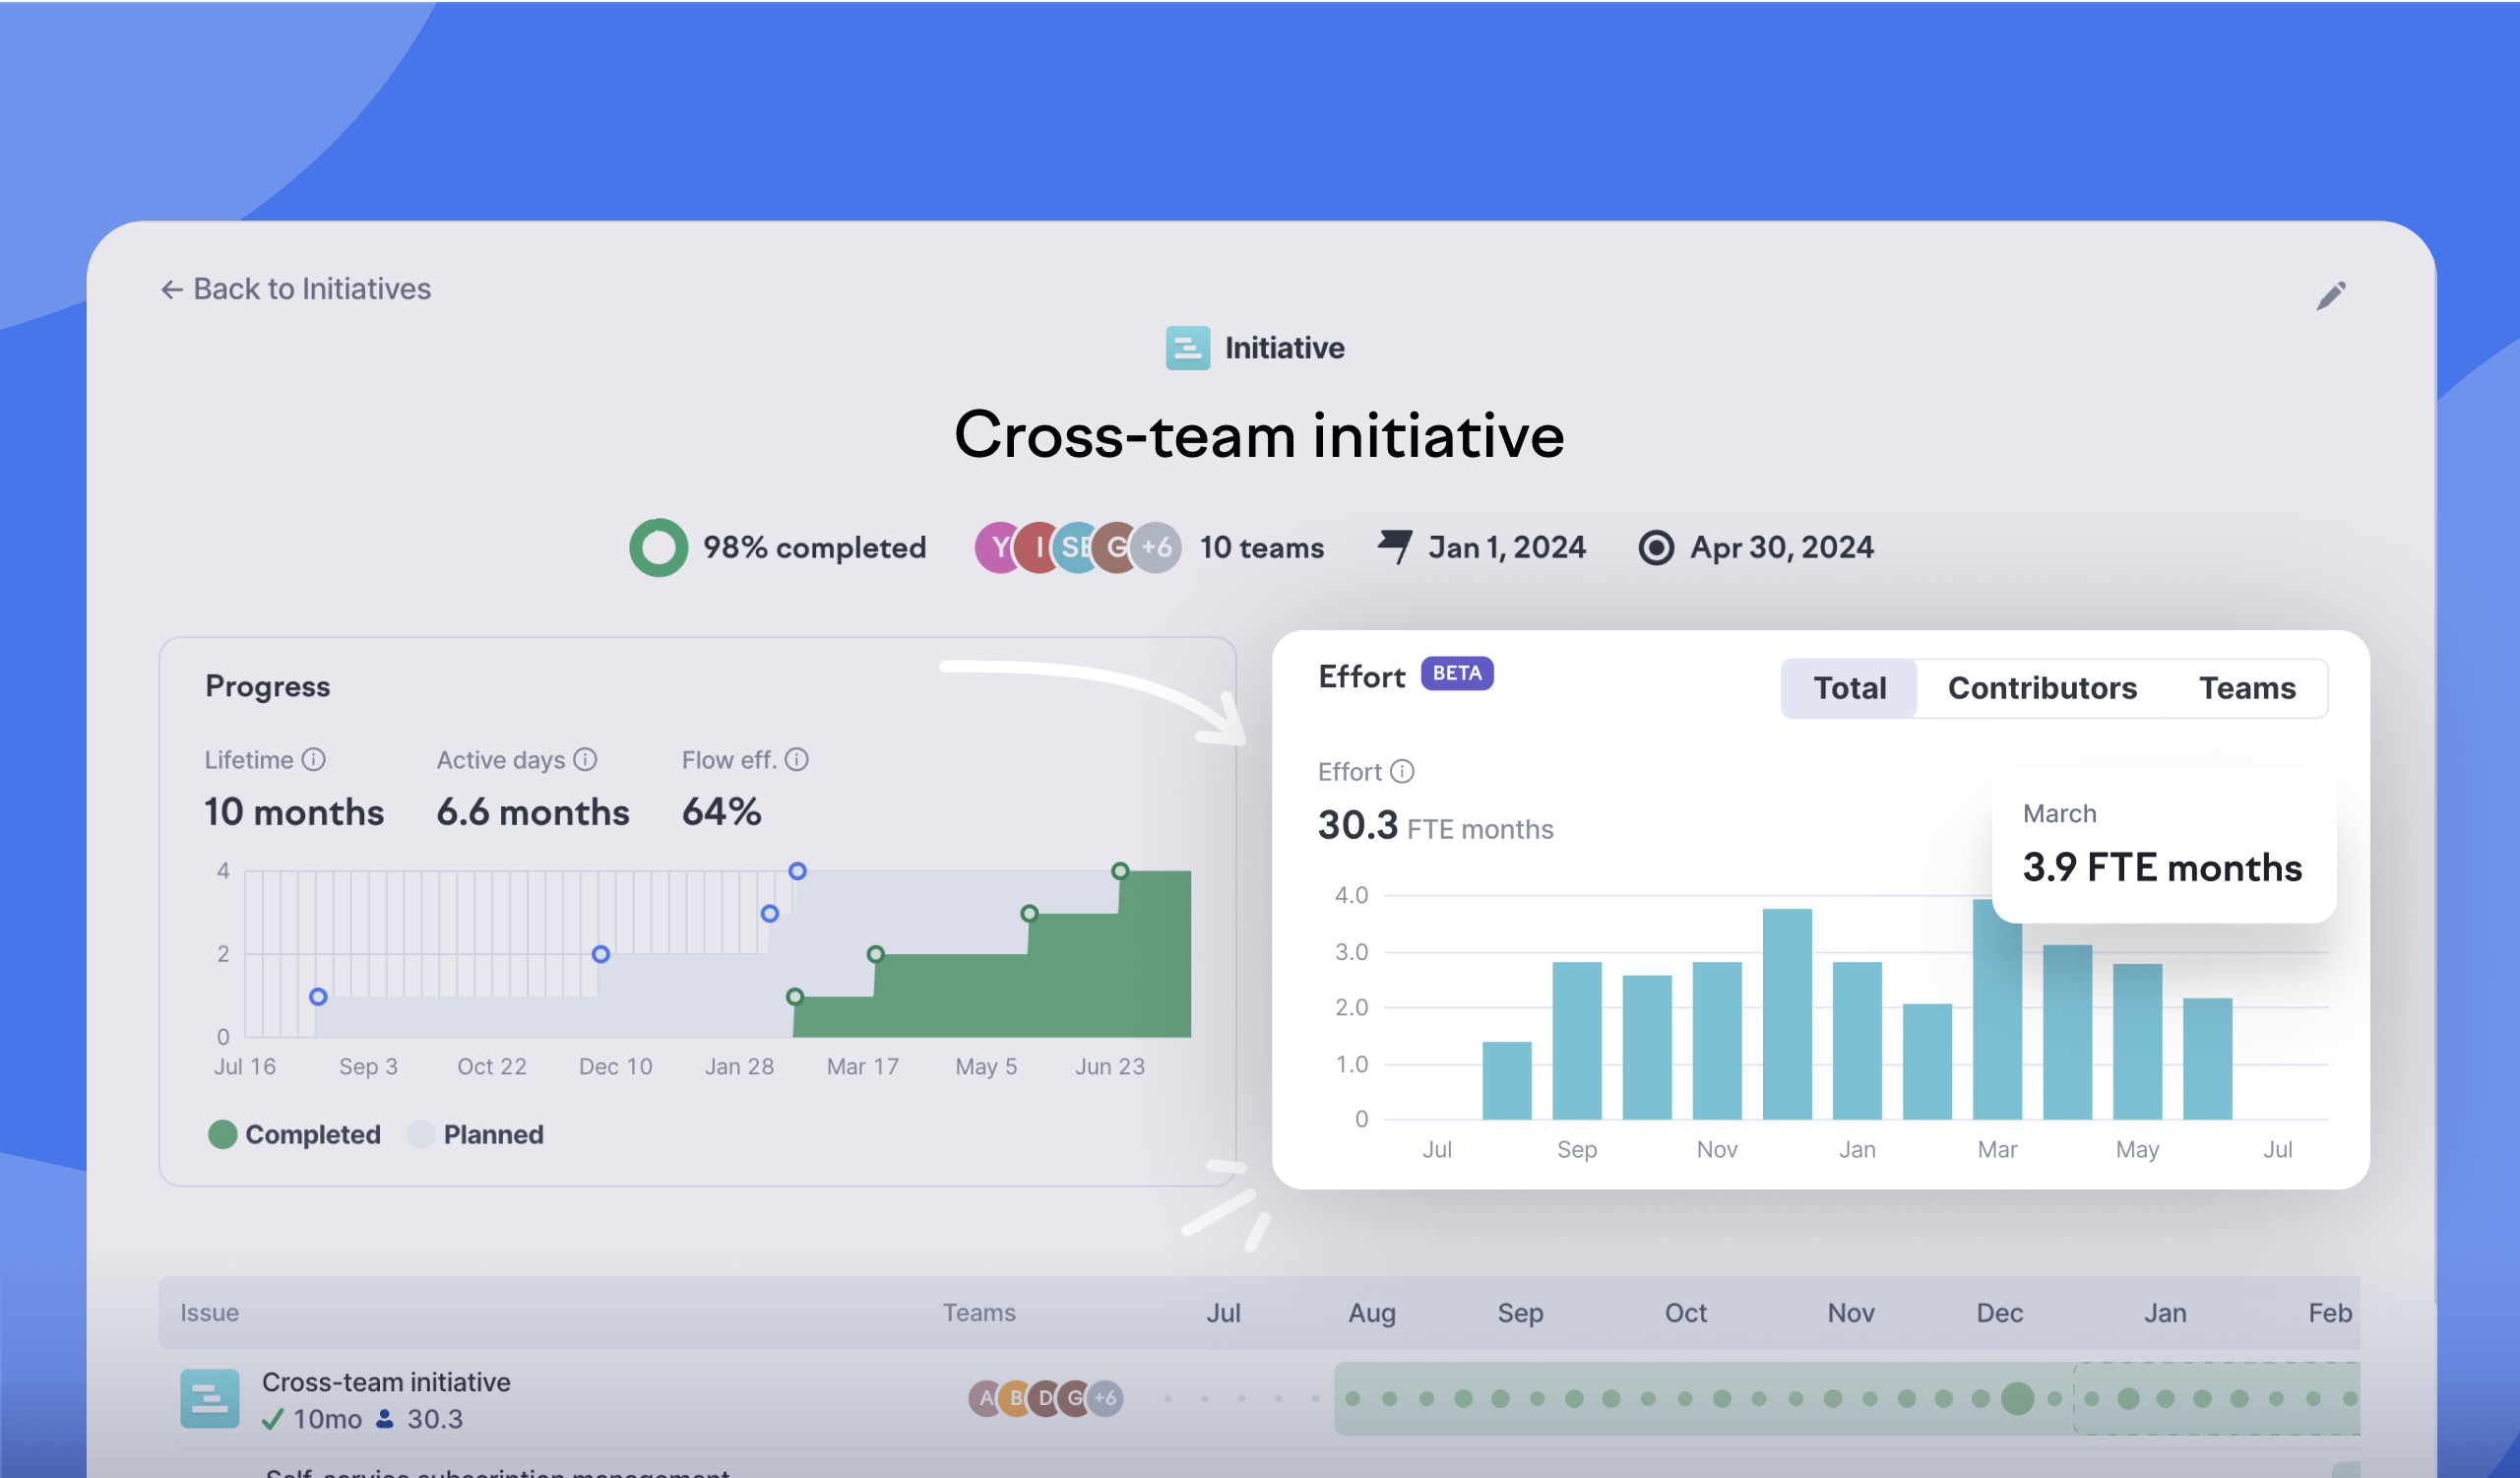
You can already view total effort for individual issues and initiatives across the app, as well as month-over-month effort and a breakdown by contributor. In the coming weeks, we’ll introduce effort metrics to the investment balance and other parts of Swarmia.
Subscribe to our newsletter
Get the latest product updates and #goodreads delivered to your inbox once a month.