Developer experience surveys can generate a lot of data, leaving you to figure out where to focus. You probably want to know what’s a good rating for each question, which teams need the most support, and whether you’re going in the right direction.
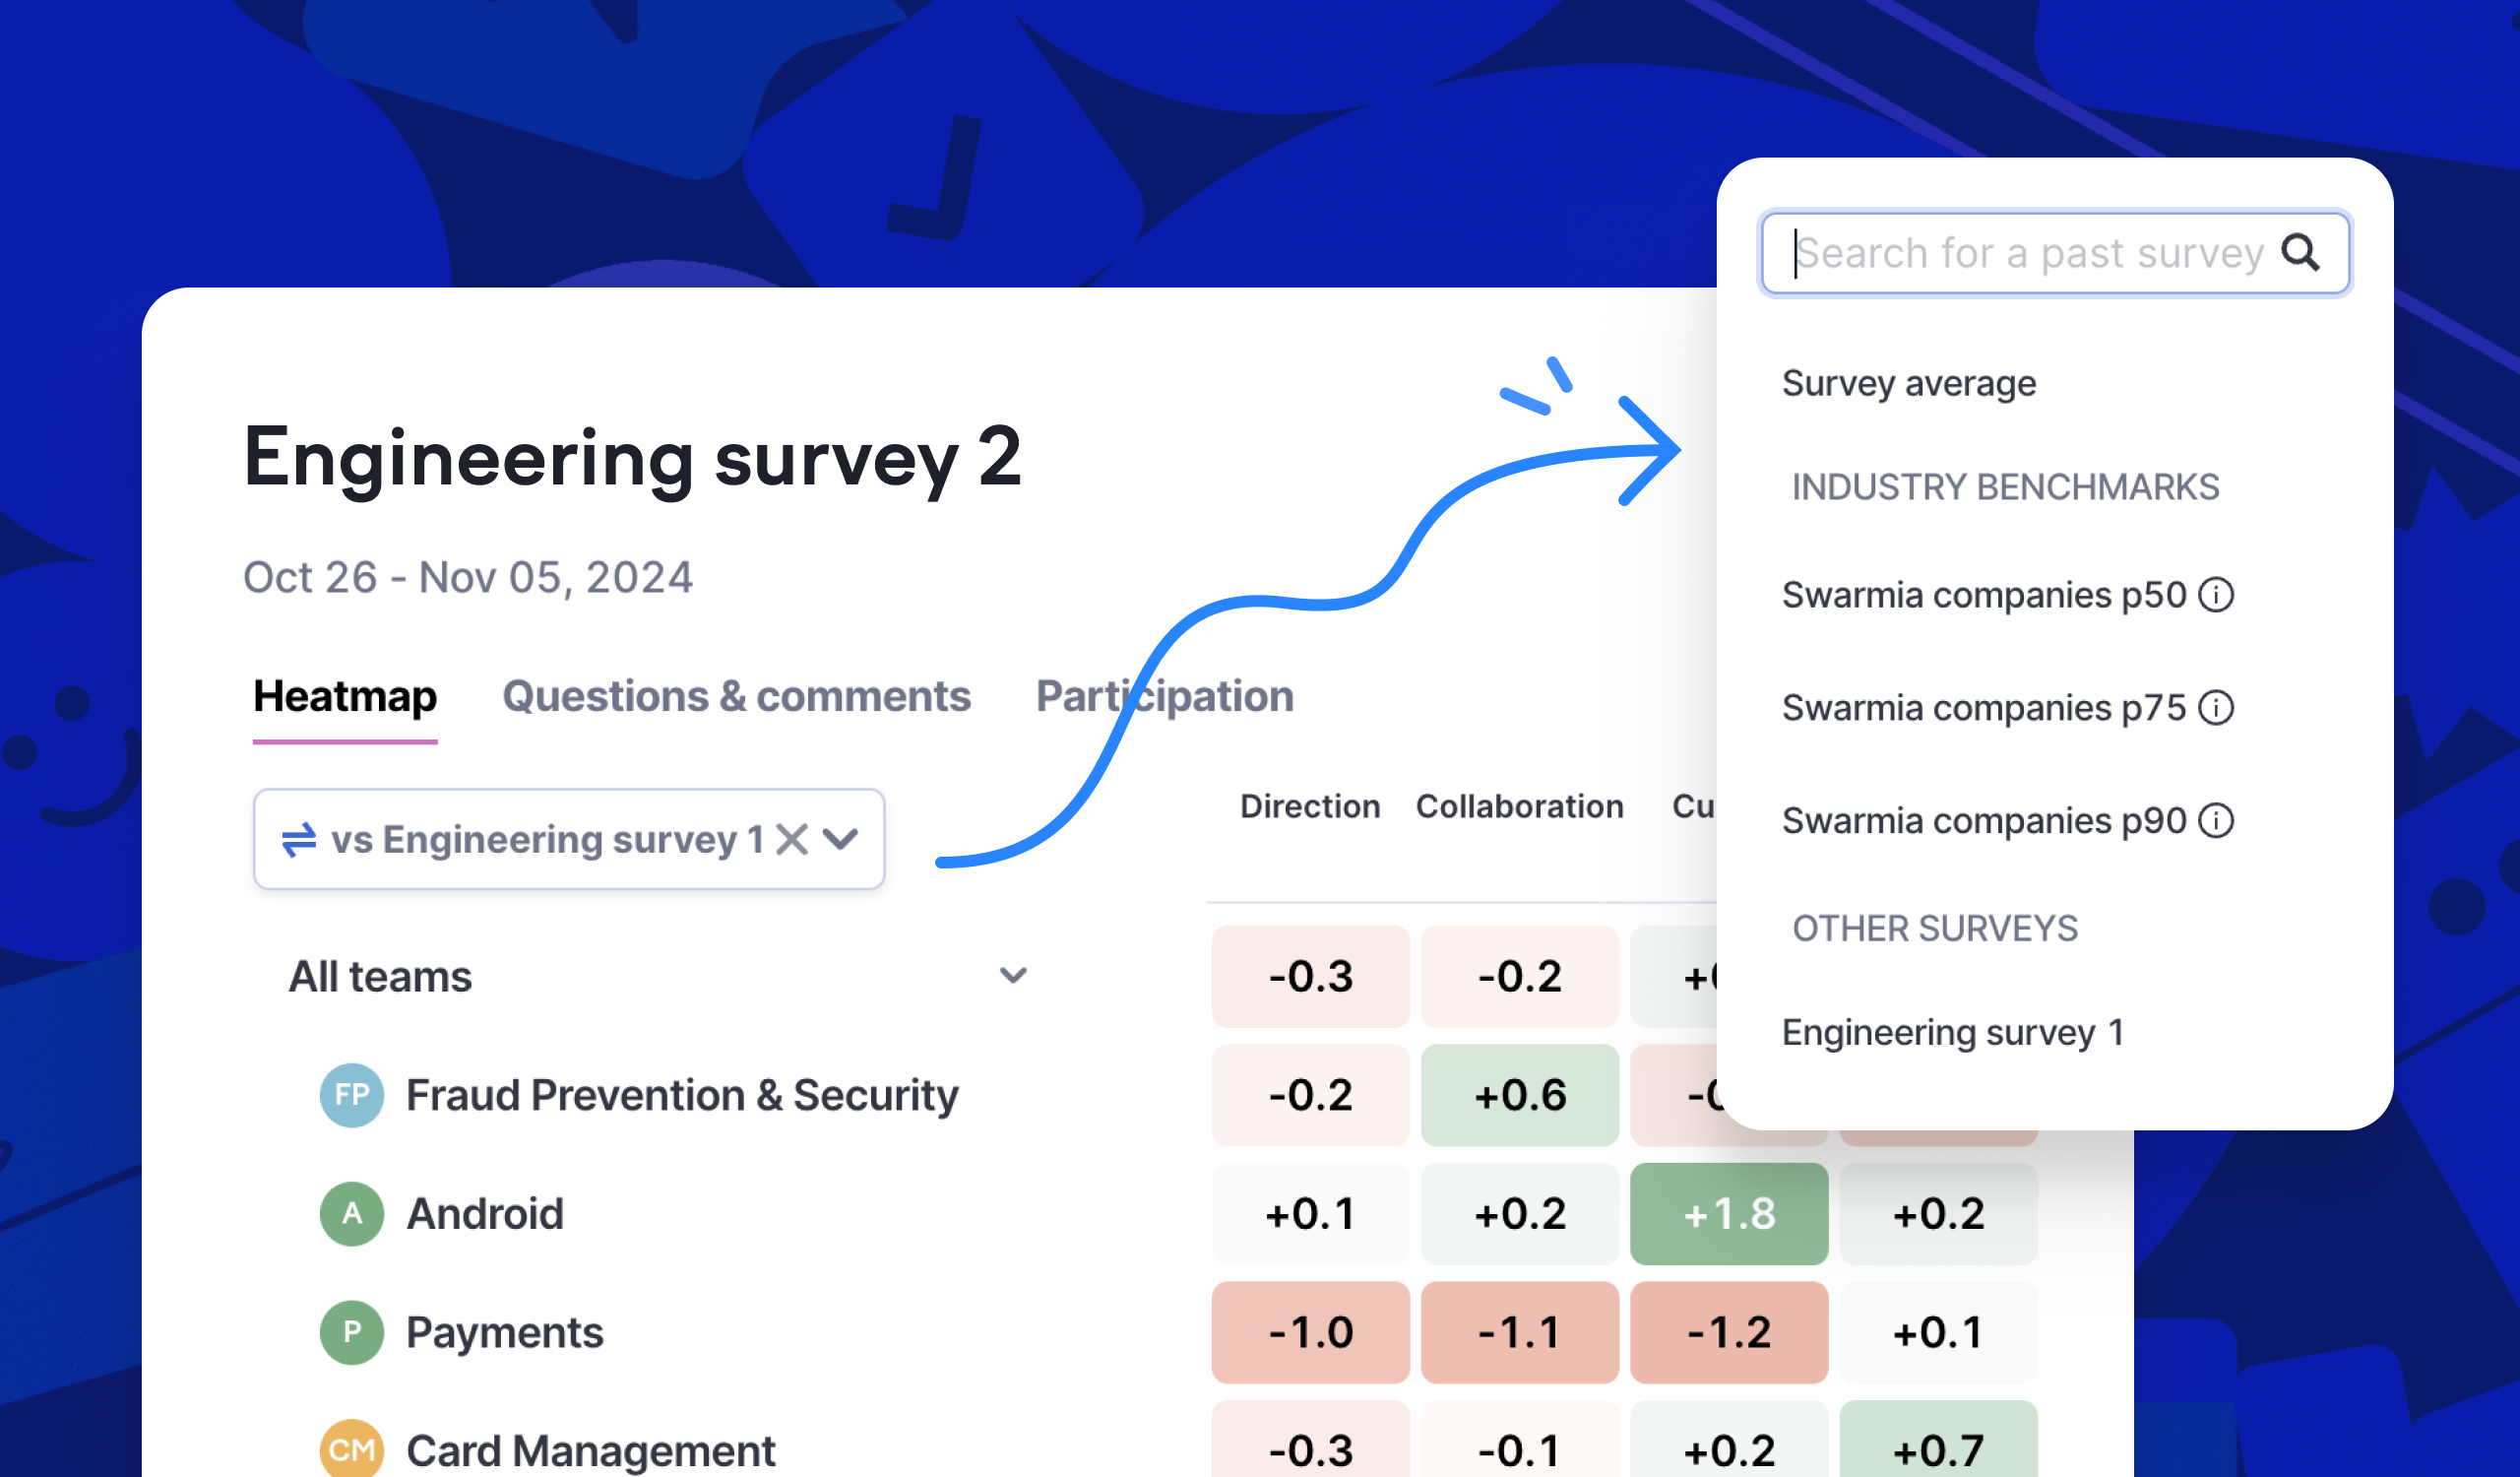
To help you with all of that, our survey results heatmap now has a new comparison mode with three options:
- Survey average: Easily see how much each team is above or below the survey’s average in each topic and question.
- Industry benchmarks: See how your results compare with Swarmia customers’ averages. You can choose from three percentiles: p50 (median), p75, and p90. The benchmarks are available for all of Swarmia’s 32 built-in questions.
- Another survey: Select any of your surveys and see the changes in scores between them. If some of the included teams or questions have changed between the surveys, we automatically include just the overlapping part in the comparison.