Product updates
See more detail on how your teams use GitHub Copilot
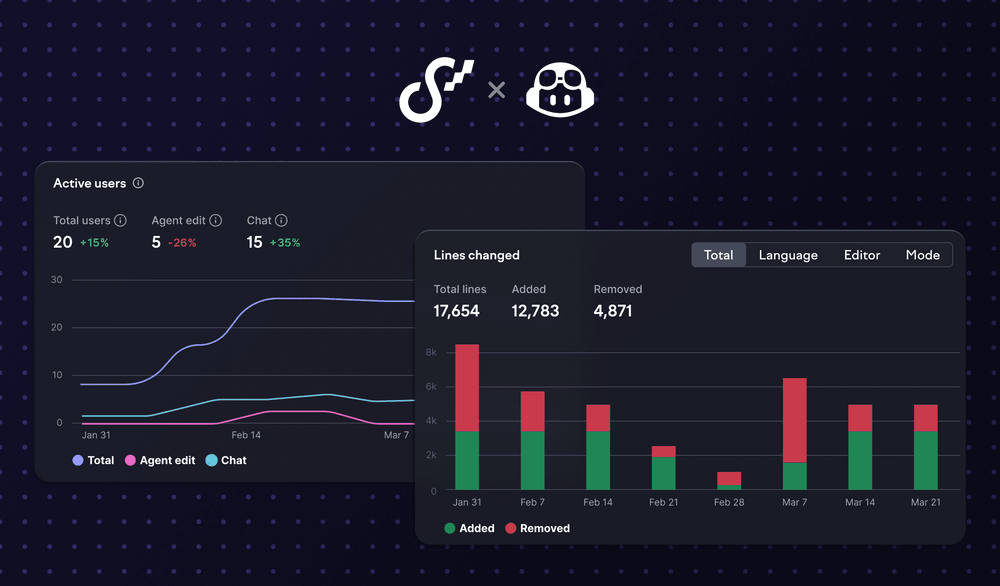
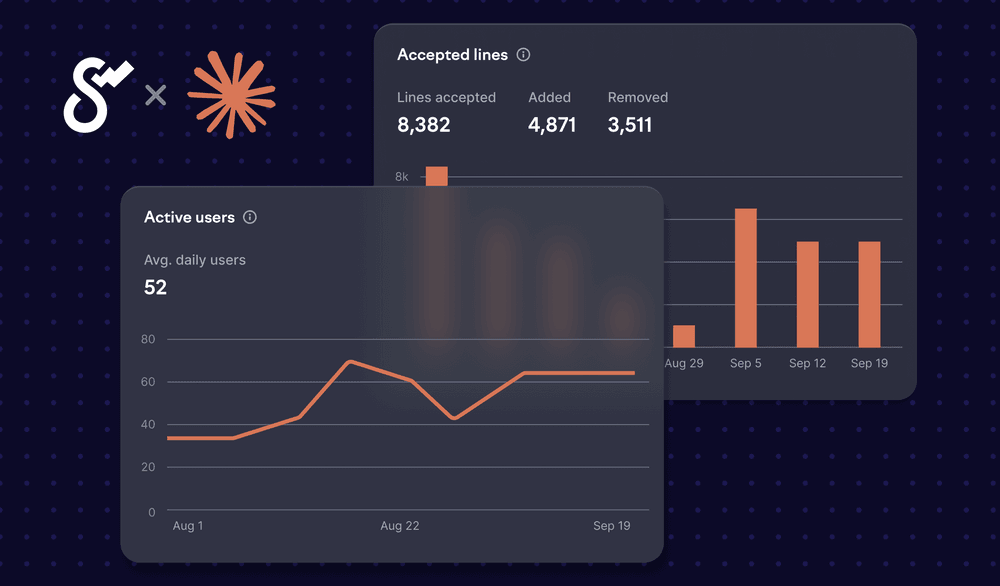
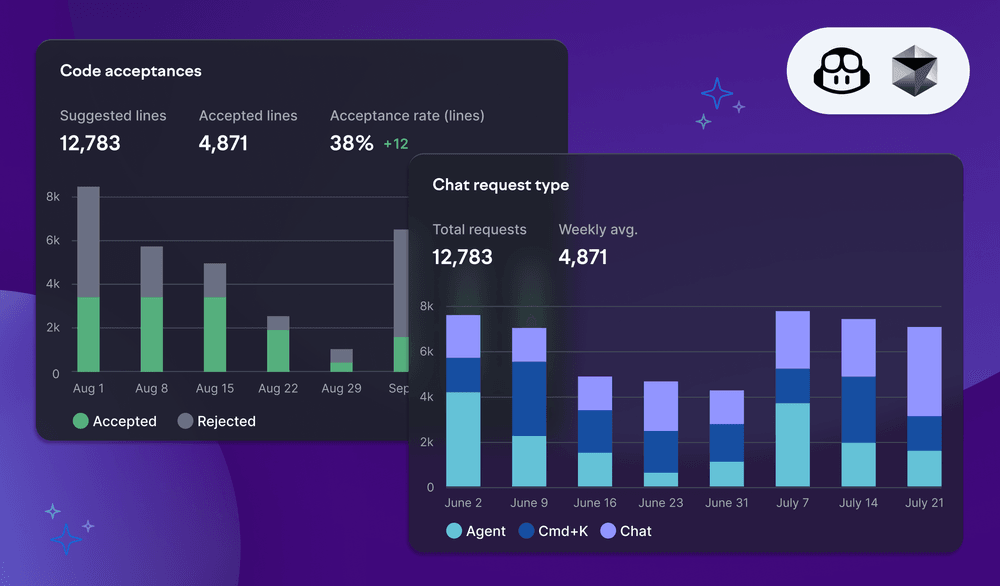
We’ve revamped the GitHub Copilot activity view to give you more granular and accurate data on how your organization is using AI.
Active users, broken down by feature. You can now see the number of active users by the Copilot features they use — code completion, chat, and agent mode. The previous view relied on GitHub’s broad definitions of active and engaged users, which also counted users regardless of the features they used.
More activity data across features. Instead of only seeing code completion data, you can now view requests and AI-generated lines of code across 7 features, including agent mode, inline chat, and code completion. This makes it easier to see which teams are taking advantage of the more advanced Copilot features and how usage is trending over time.
Chat requests by model. See which AI models your teams are using for Copilot chat — whether it’s Claude Opus 4.6, GPT-5.4, or something else. This helps you understand whether people are sticking with defaults or experimenting with the latest models, which can serve as a starting point for a conversation about which ones perform best for you.
Swarmia teams instead of GitHub teams. Data is now grouped by Swarmia teams, making it consistent and comparable with other views in Swarmia. There’s no minimum team size restriction anymore.
As before, you can also view lines changed by language and editor — useful for understanding whether Copilot usage matches your codebase or if some languages are over- or underrepresented.
To get started, navigate to AI tools → AI activity → GitHub Copilot in Swarmia and follow the instructions to enable Copilot usage metrics in your GitHub organization settings. You�’ll get historical activity data starting from December 12, 2025.
Get a clearer view into large initiatives and epics
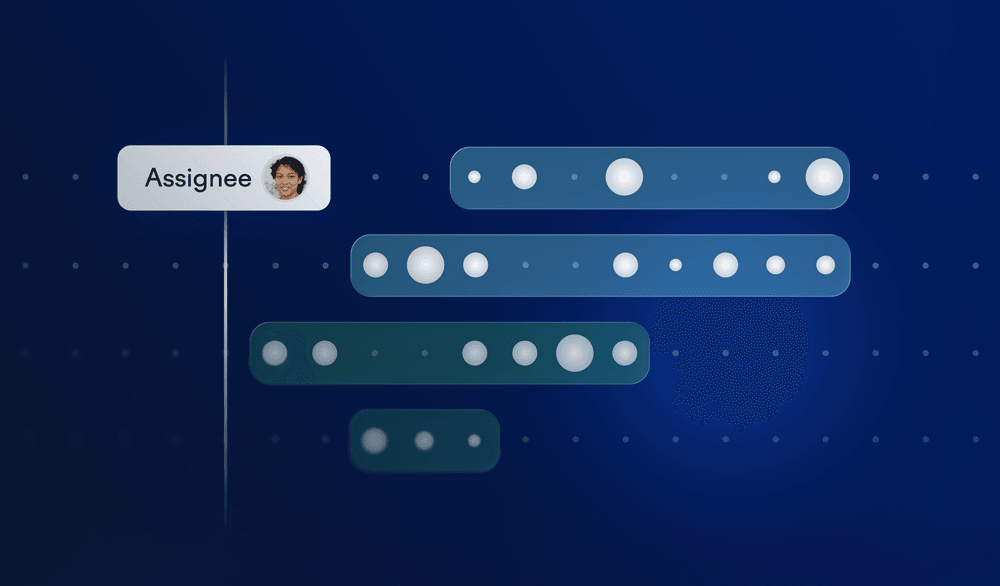
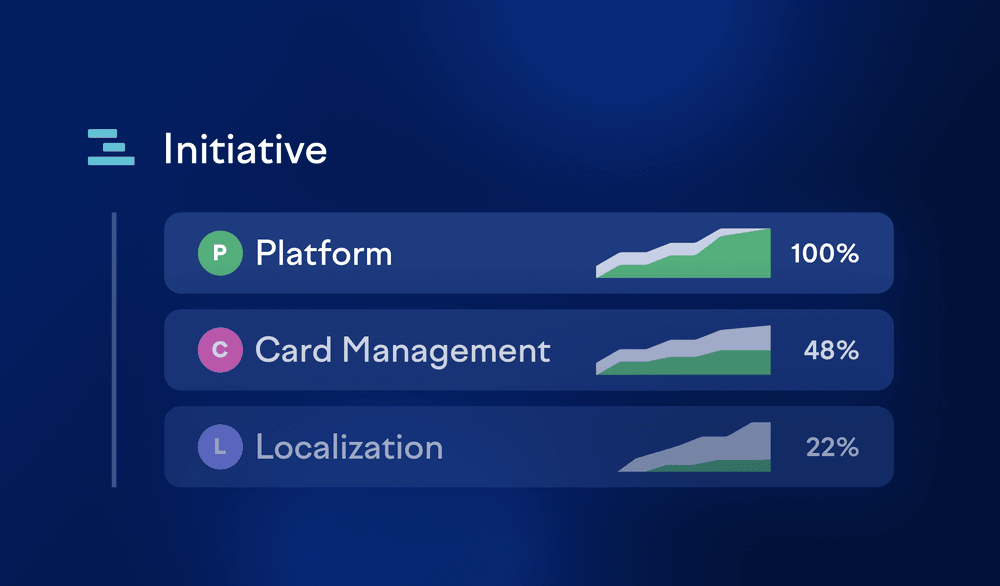
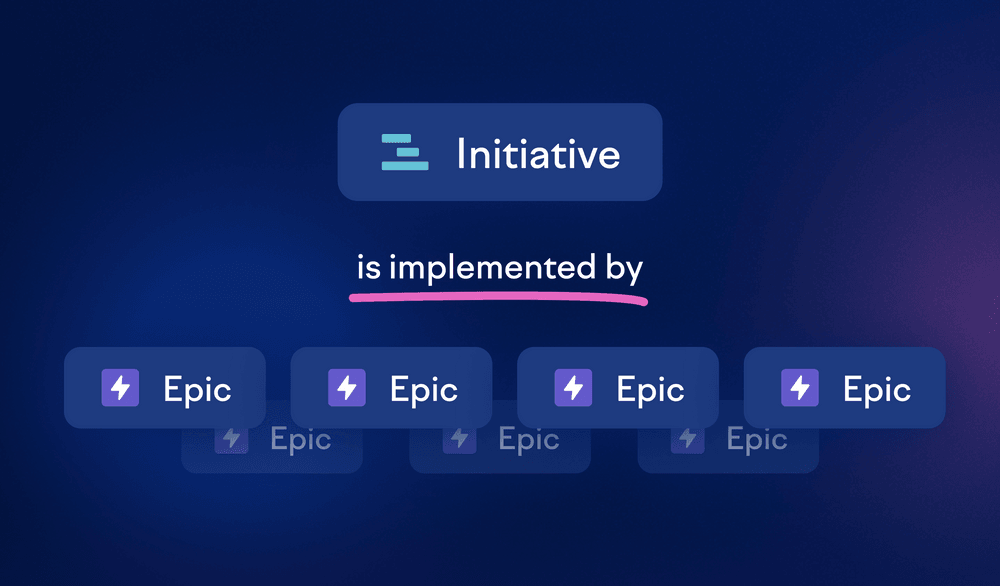
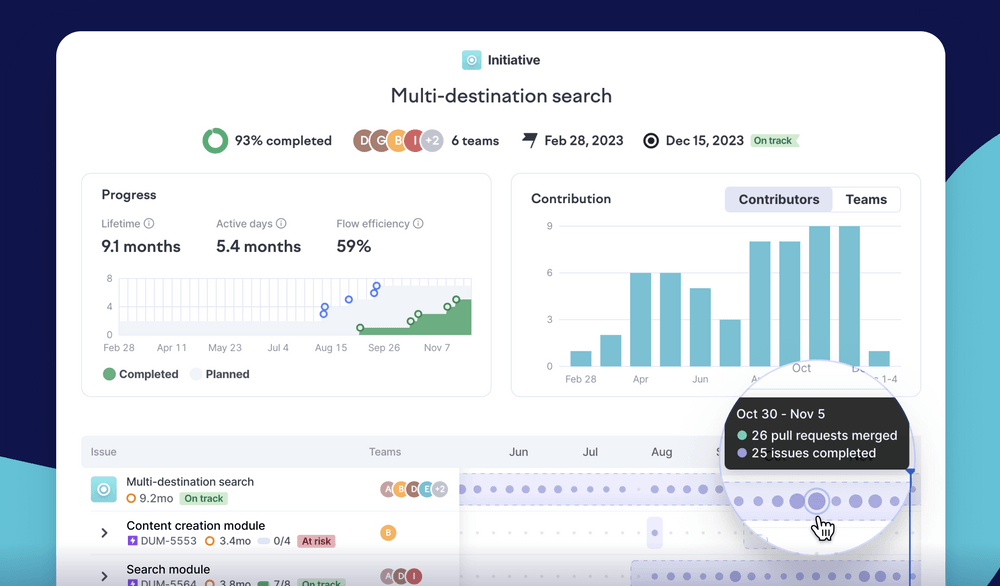
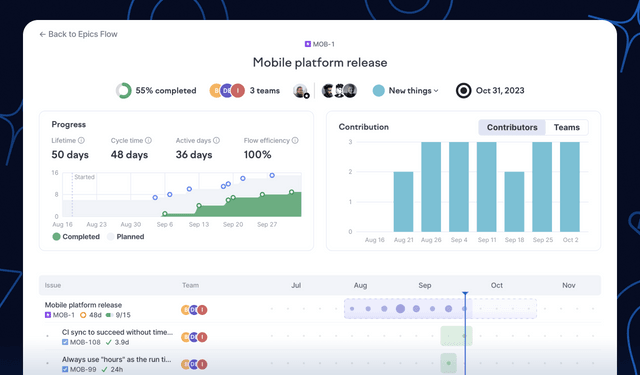
If you’re running cross-team projects with hundreds of sub-items, visualizing the work that actually matters to you may have been a challenge. We’ve made several improvements to the issue and initiative timeline to help with that.

More filters and ordering options. You can now filter the timeline to show only the issues assigned to you, or narrow it down to work that’s currently in progress. New ordering options let you sort by last activity, created date, or title.
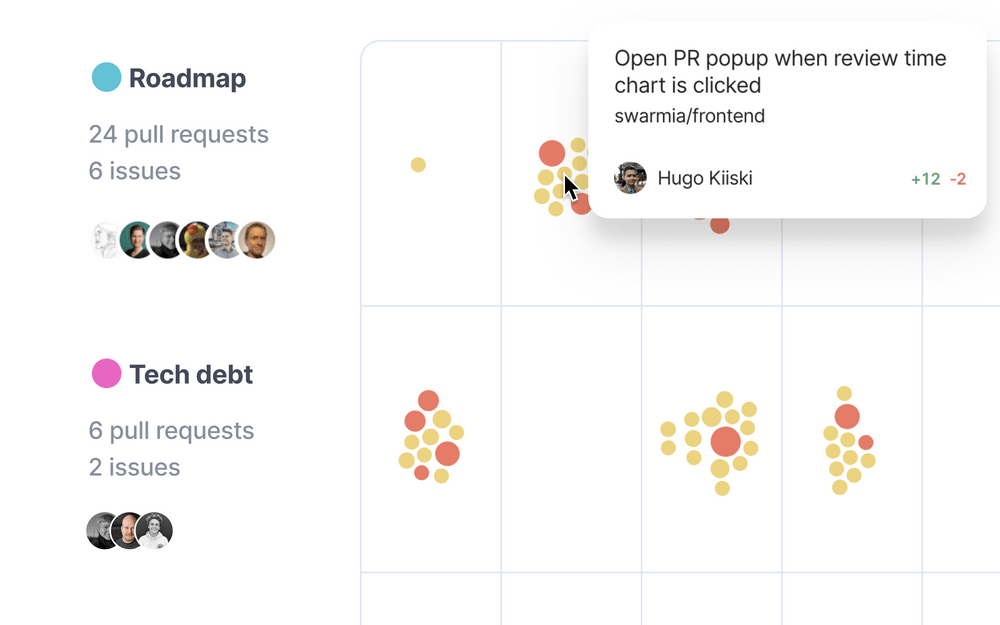
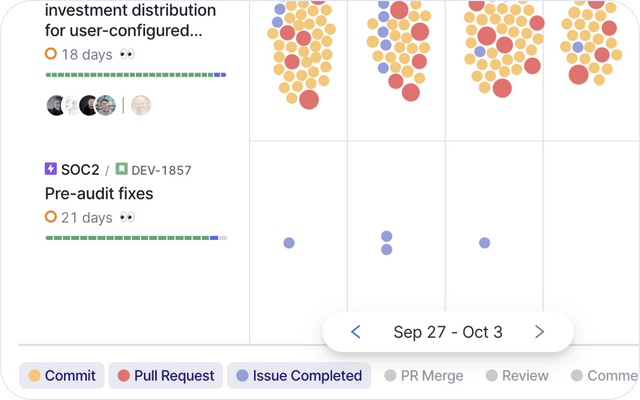
More events on the timeline. The activity timeline now shows a fuller picture of what’s happened in an issue or initiative and includes everything where the effort is actually coming from. This makes it easier to understand the amount of activity without having to dig through each sub-item individually.
Better performance. Large initiatives and epics with hundreds of issues now load faster.
To see the improvements, navigate to the overview of any issue or initiative and explore the updated timeline.
More updates
- Configurable file exclusions are now available in settings > pull requests > file exclusions. The file paths matching gitignore-style rules will be excluded from PR size calculations (lines changed, additions, deletions).
Support for all Claude Code setups
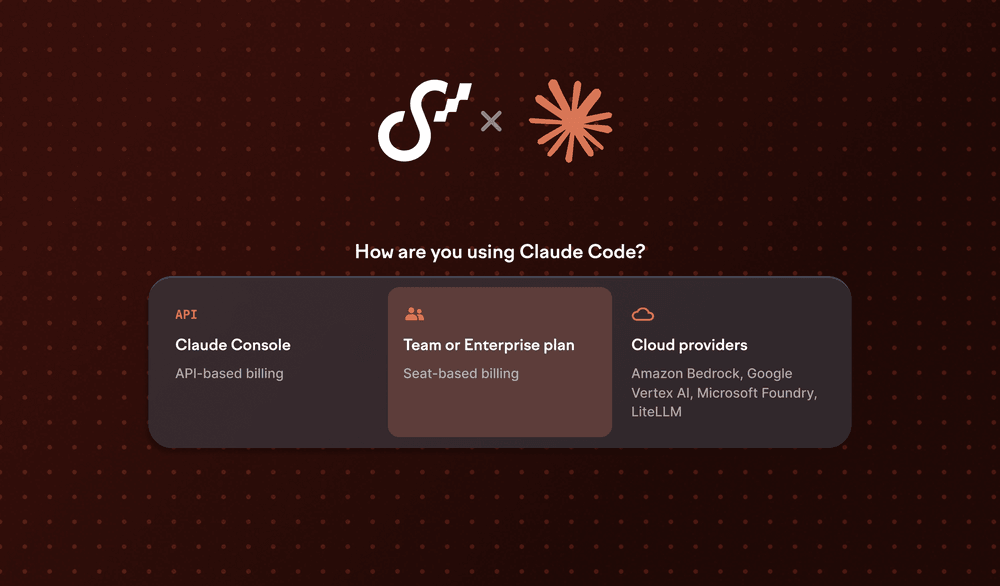
We’re extending our Claude Code support. Now, Swarmia is compatible with every way you can run Claude Code:
- Claude Console: API-based billing
- Team or Enterprise plan: Seat-based billing
- Cloud providers: Amazon Bedrock, Google Vertex AI, Microsoft Foundry, and LiteLLM
The new integration uses Claude Code’s OpenTelemetry monitoring to send event-level data directly to Swarmia — giving you full access to all the same metrics regardless of your setup:
- Adoption: See which teams are using Claude Code and who the most active users are.
- Activity: Understand how much code Claude Code is creating for you.
- Attribution: Know which pull requests have been assisted by Claude Code.
- Impact: Compare Claude Code-assisted PRs against your productivity metrics, including throughput, cycle time, batch size, and time to review.
Whether you’re rolling out Claude Code to a few teams or across the whole organization, you can now track adoption and measure its impact from day one.
To get started, go to settings → AI tools → Claude Code → add new. We’ll suggest the most suitable integration option based on your setup.
Import time-off periods via API to improve data accuracy
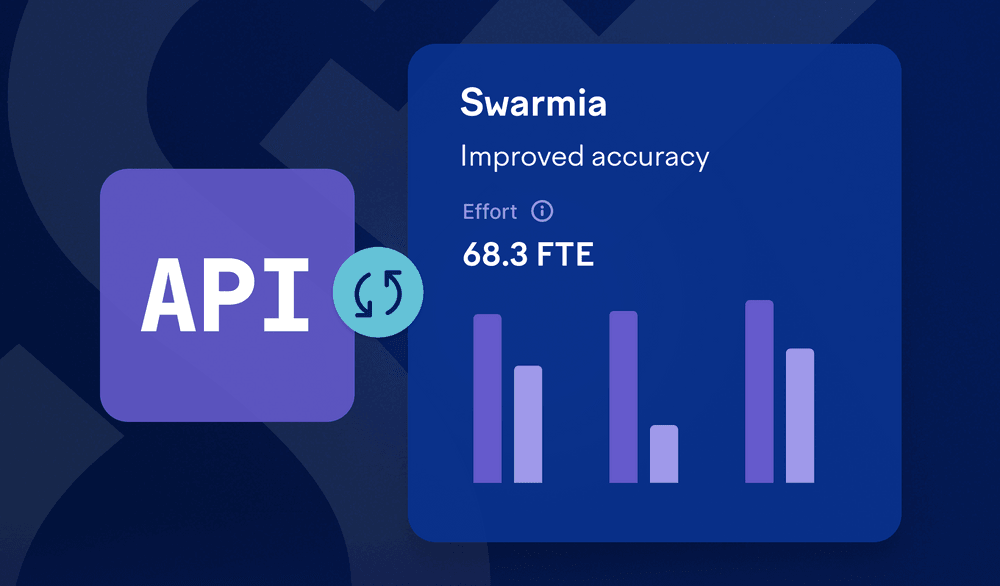
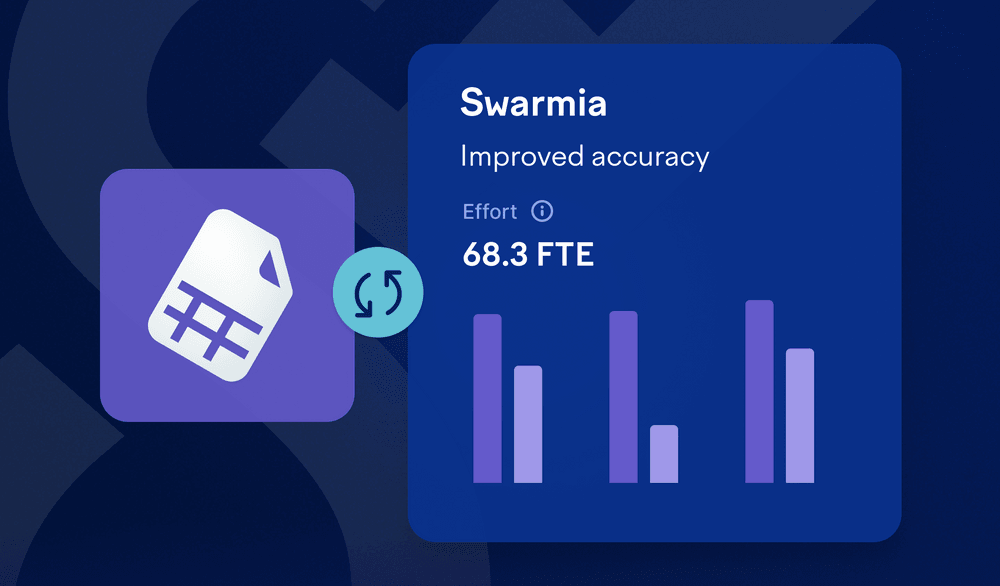
Accurate full-time equivalent (FTE) data is essential for investment balance insights and software capitalization. Now you can import time-off data through our API, giving you another way to maintain precise effort calculations.
Time-off periods directly impact your FTE calculations, which determine how much engineering effort goes into capitalizable work. Without accounting for vacations, sick days, and other time away, your capitalization reports could overstate the actual effort invested in new features versus maintenance work.
You now have three options for importing time-off data to Swarmia:
- HR system integration: Connect your HR system directly for automatic sync
- CSV import: Upload time-off records manually with a CSV file
- API import (new): Automate time-off data imports from your own systems
To get started, navigate to settings → integrations → HR system and select the API tab. You’ll find more information about the API and the related documentation next to the file upload.
More updates
- We recently completed a SOC 1 (Type 1) audit for our software capitalization feature, ensuring the reliability and correctness of our internal control for financial reporting.
Assign issues to the right investment category with AI
Keeping your investment balance up to date can be time-consuming. You need to create rules, maintain labels, and ensure everyone on the team follows the same process. Even with the best intentions, work still slips through the cracks and ends up uncategorized.

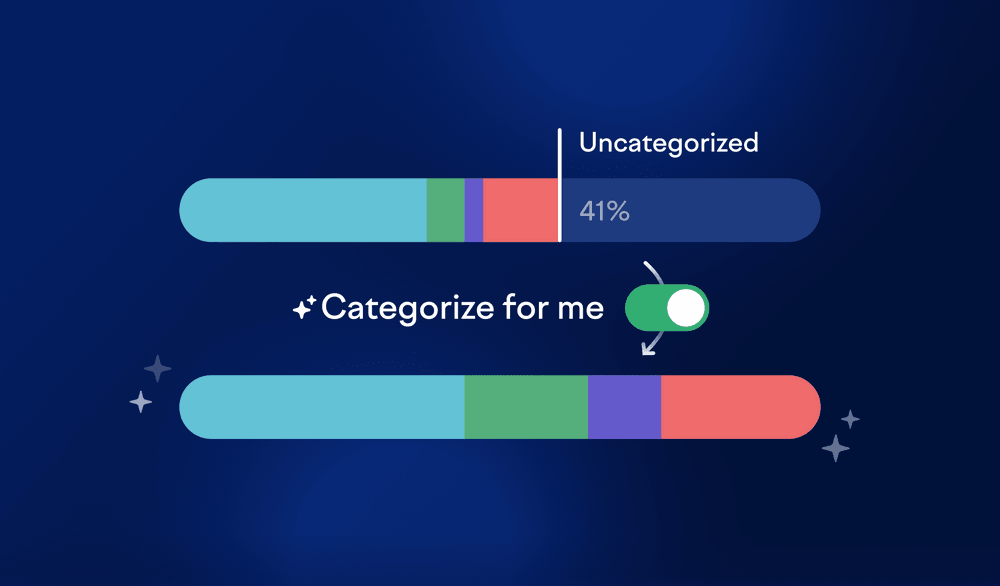
You can now toggle automatic categorization for uncategorized work in your investment balance breakdowns. Instead of manually creating rules for every edge case, Swarmia analyzes each issue’s description, linked issues, and other metadata to find the most suitable category.
Describe your categories and you’re good to go
AI categorization works with your existing rule-based categorization. Swarmia first applies your rules, then uses AI to categorize any remaining uncategorized issues.

To use AI categorization, you need to add descriptions to your investment categories. The better your category descriptions, the better the results. For more details, read our short guide to good category descriptions.
You can always review AI-categorized issues in the categorization view to see how they’ve been assigned.
Automatic categorization opens new research questions
Investment balance helps you understand what your team is working on and whether it aligns with your strategy. But if 40% of your work is uncategorized, you’re missing a significant part of the picture.
AI categorization helps you reduce uncategorized work to 0% and even open entirely new breakdowns without rolling out new processes. For example, you could create a breakdown for “customer-facing vs. internal work” or “maintenance vs. growth” and let AI handle the categorization based on your descriptions.
Getting started
Get started by editing any existing investment balance breakdown or creating a new one, then toggle on AI categorization. You’ll find the toggle in the breakdown settings, right below where you define your categories and rules.
More updates
- You can now find suggestions to link pull requests to issues inside the app — the same ones you see in Slack notifications. This makes it easier to find the right issue in the PR inbox.
Analyze code changes with the new codebase view
You can now see exactly which parts of your codebase are changing and when. The new codebase view aggregates all file changes from pull requests into a tree structure, making it easy to spot patterns and explore your code activity.
The view organizes changes by repository, folder, and file, showing metrics like the number of PRs, lines changed, and contributors for each part of your codebase. This allows you to identify hotspots and understand where your team’s effort is going.

Use it to answer questions like:
- Which files are being edited by AI coding assistants?
- Which folders has a team worked on most this quarter?
- Who has contributed to this part of the codebase?
- Which files are most commonly part of reverted PRs?
Combine the view with PR filters to dive deeper. For example, filter by team, time period, or PR characteristics to see how different segments of work affect different parts of your code.
The view is based entirely on filenames — no source code is accessed — so your code stays private while you get the insights you need.
Try it out by navigating to metrics → code metrics → codebase.
Compare your metrics with benchmarks and organization averages
Understanding whether your team’s performance is on track can be tricky. Are your pull request cycle times good enough? Should you be concerned about your change failure rate? Which teams might need extra support?
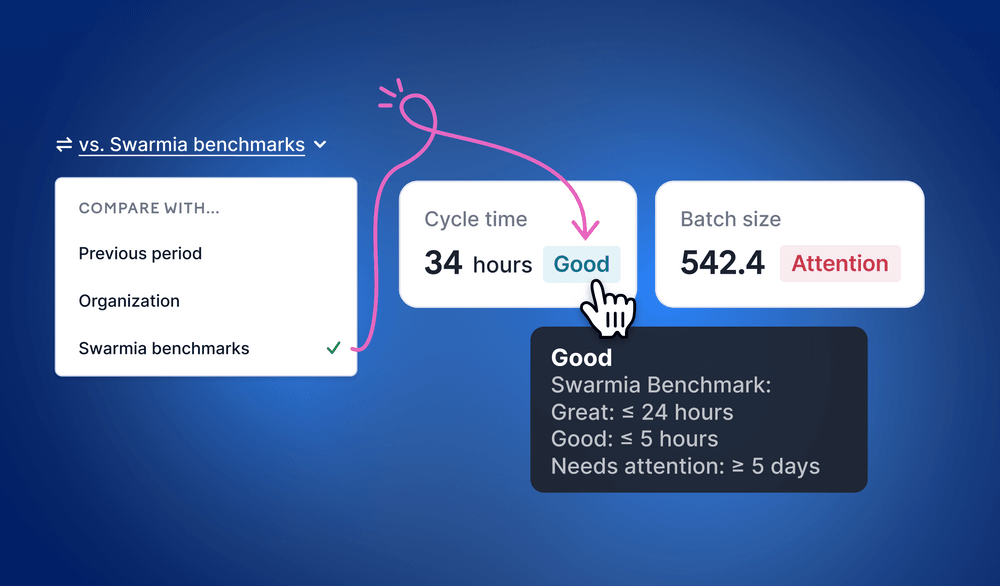
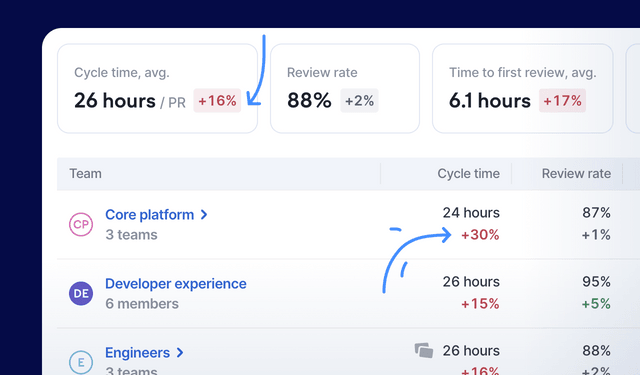
You can now compare your engineering metrics against Swarmia benchmarks and your team against the organization average. This makes it easier to spot improvement areas and identify which teams are doing well.
When viewing metrics in Swarmia, click the previous period button above the table to select from three options:
- Previous period (default): See how metrics have changed over time.
- Organization: Compare individual teams against your organization’s baseline.
- Swarmia benchmark: See how you stack up against industry standards.
For previous period and organization comparisons, you’ll see the difference displayed next to each metric. When using Swarmia benchmarks, you’ll see a color-coded label — great, good, or attention — showing how your performance compares to proven benchmarks.
Benchmarks are available for code metrics (pull request cycle time and batch size) and DORA metrics. Organization comparisons work across code, DORA, and issue metrics.
The comparisons help you quickly answer questions like “Which aspects of our delivery are we doing well, and where can we improve?” or “Which teams might need additional support?”
For example, if your change failure rate shows “attention” while your lead time is “great,” you know exactly where to focus your improvement efforts. Or if one team’s cycle time is significantly above your organization’s average, you can investigate what’s slowing them down.
To get started, navigate to the metrics views in Swarmia, click previous period above the table, and select either organization or Swarmia benchmark.
Use Linear and Jira side by side in Swarmia (beta)
Companies change and evolve, and so do the tools they use. Whether you’re migrating from one issue tracker to another, recently merged with another company, or simply let teams choose the tools that work best for them, managing work across multiple issue trackers can be a leadership nightmare.
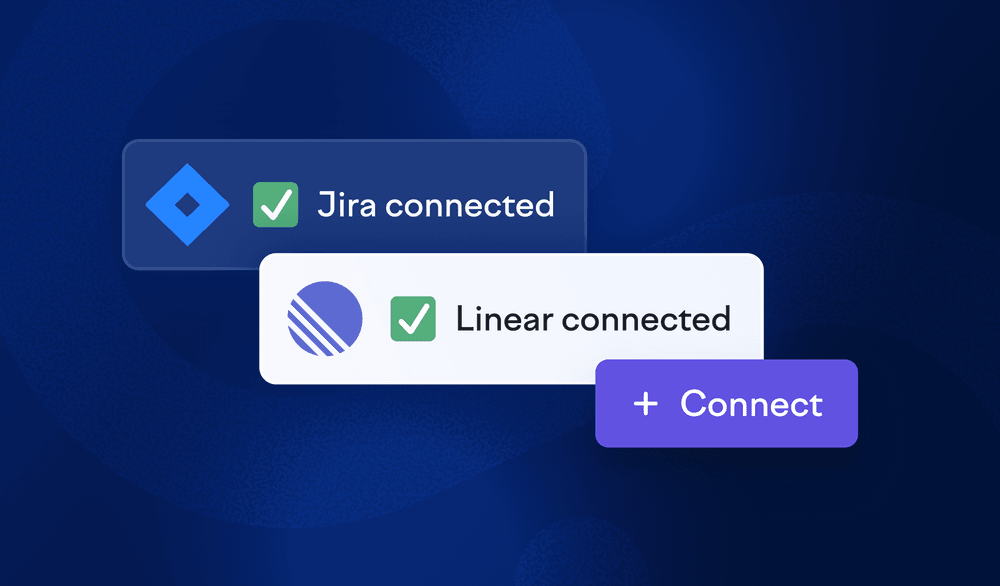
That’s why we’re launching beta support for connecting both Linear and Jira to Swarmia at the same time. Now you can get comparable metrics and insights across both tools, helping you bridge the gap when teams are using different systems.
Here’s what you can do:
Filter by issue tracker anywhere in Swarmia. Throughout the app, you can choose to view issues from one issue tracker or both.
Assign teams to own issues from either source. Configure which issue tracker(s) each team uses, so Swarmia can accurately map work to the right teams.
Combine issues into a single initiative. Track the progress of strategic projects that span multiple teams and tools by creating initiatives that include issues from both Linear and Jira.
Connecting both Linear and Jira is currently in beta. To join, get in touch with your customer success manager or contact us at hello@swarmia.com.
In the coming months, we’re also adding support for connecting multiple Jira instances. If you’re interested in early access, reach out to us.
Analyze AI coding agents’ work
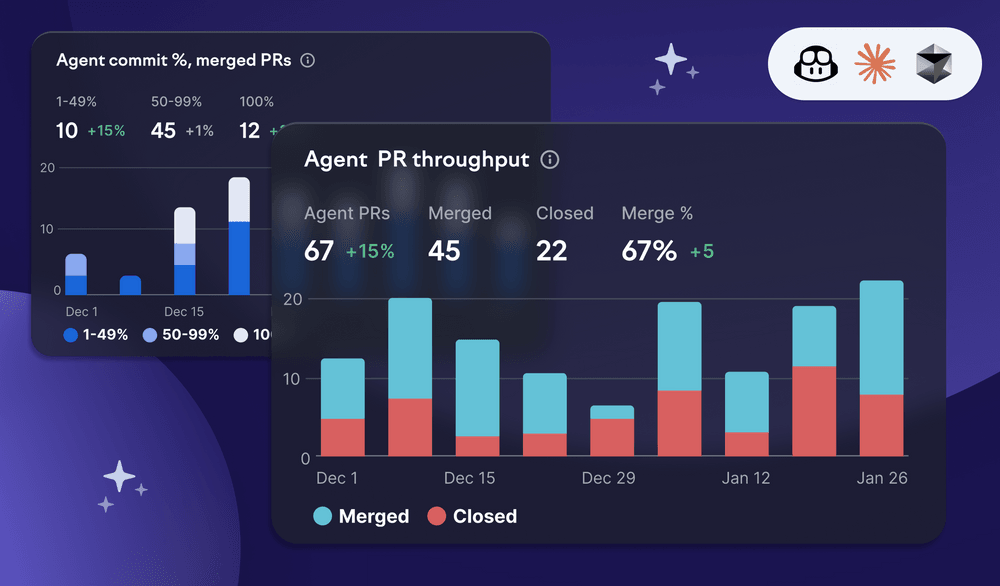
AI coding agents create pull requests end-to-end, not just suggest code in your editor — they plan work, write code, run tests, and respond to reviews. Swarmia’s new Coding agents view helps you see how these agents are contributing across your organization.
- Agent adoption: See PRs created by GitHub Copilot, Cursor, and Claude Code across all your teams and repositories.
- Usage patterns:
- Track how many agent PRs get merged versus closed to understand whether they’re mostly throwaway experiments or actually end up in production.
- Follow the share of PRs created entirely by agents to judge how often engineers need to intervene manually.
- Examine the batch size distribution to understand the complexity of the tasks the agents are able to complete.
- Trends over time: Understand whether agent usage is growing, and what’s driving it.
- Team comparisons: See which teams are getting the most value from agents.
- Drill-downs: Look at individual PRs to understand what’s working and what isn’t.
Whether you’re in leadership looking to understand adoption patterns across your organization, or on a team trying to figure out what works and what doesn’t, this view gives you the answers you’re looking for.
To get started, navigate to AI tools → Coding agents. The view will work out-of-the-box, with no need for you to configure anything.
Choose how to aggregate metrics with percentiles
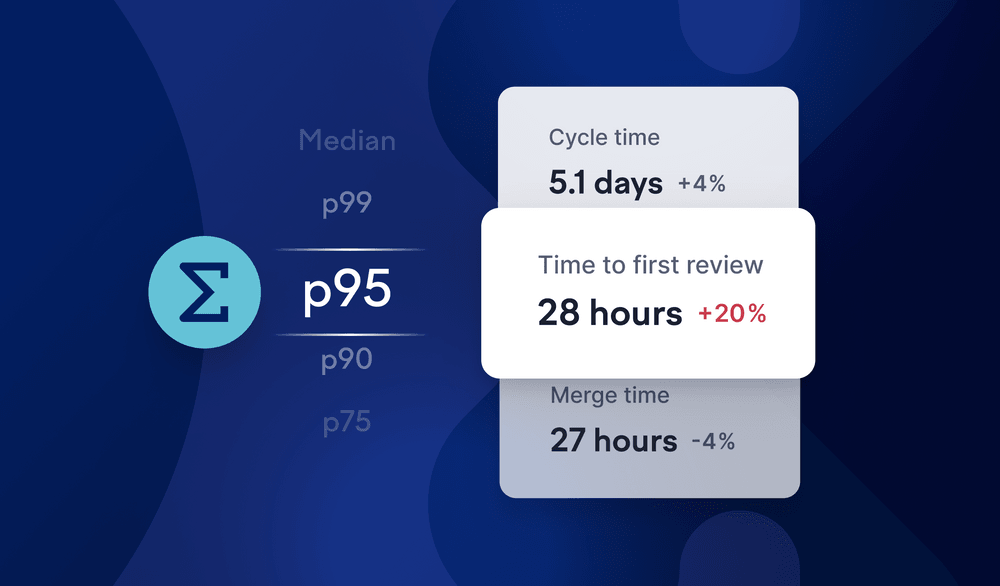
You can now view metrics using percentiles instead of just averages. In the code metrics view, you’ll find a new dropdown that lets you switch between different aggregation methods, including median (p50), p75, p90, p95, and p99.
Averages can hide important patterns in your data and are easily skewed by outliers. Percentiles give you a clearer picture of what’s typical and help you spot edge cases. For example, use median to understand typical cycle time, p90 to see how fast most pull requests get their first review, or p99 to detect merge time outliers.
Try it out by opening the code metrics view and selecting your preferred aggregation method from the dropdown. In the coming weeks, we’ll bring percentiles to other metrics views as well.
More updates
- If you’re using GitHub and GitLab in your organization, you can now see code metrics for both.
- You’re now able to see more accurate historical metrics for teams, taking membership changes into account.
- We’ve made small updates to some code metrics definitions to more accurately reflect your work, so some numbers may slightly differ from what you’ve seen in the past.
Track survey trends over time
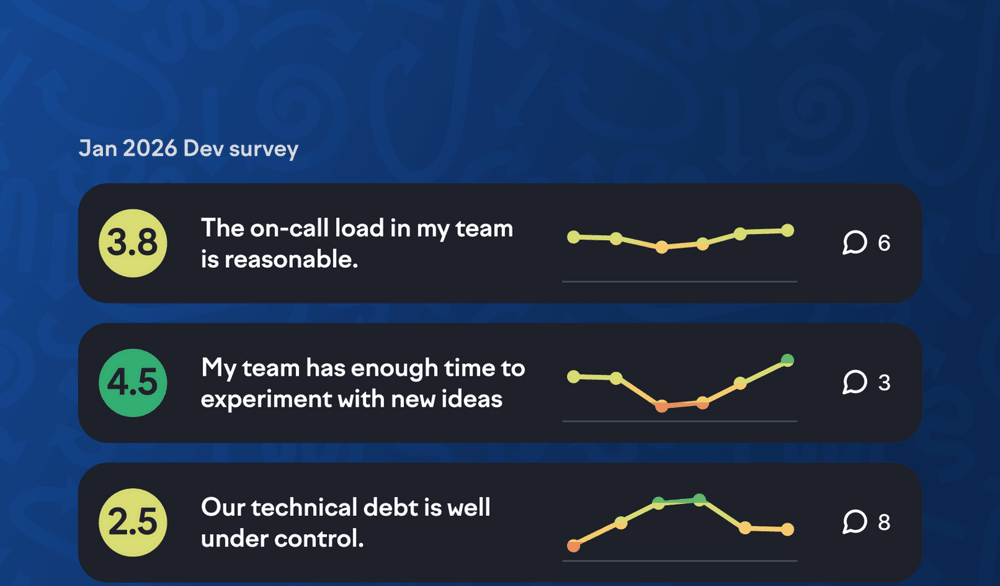
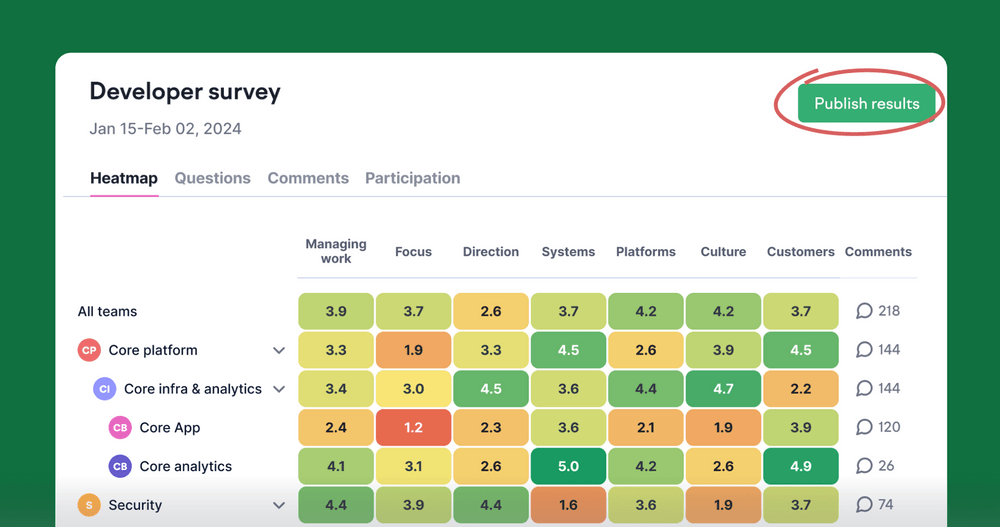
You can now see how survey scores have changed across multiple surveys with the new trend charts. Instead of comparing just two surveys at a time, you can now track progress over many surveys to understand whether things are moving in the right direction.
The trend charts appear in the questions & comments tab under surveys, and when viewing linked survey results for metrics throughout Swarmia. Hover over any data point to see the score from that survey.

The trend charts are useful for demonstrating that your improvement efforts are working. If you’ve been running recurring surveys and taking action on the feedback, you can now show the impact with clear trend data.
The feature is available for all Swarmia survey users.
More updates
- You can now see flow efficiency in the initiatives overview, making it easy to compare it across your initiatives.
- You can now change the end date of a live survey or add more teams to it.
- Survey reminders are now sent only on weekdays. You can see the exact times when creating a survey.
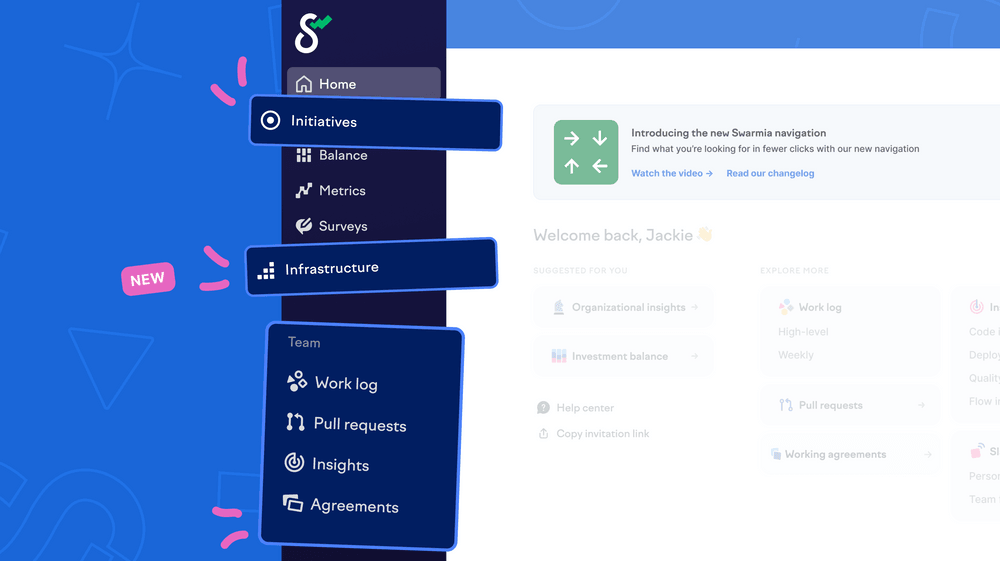
Find the insights you need with the new navigation
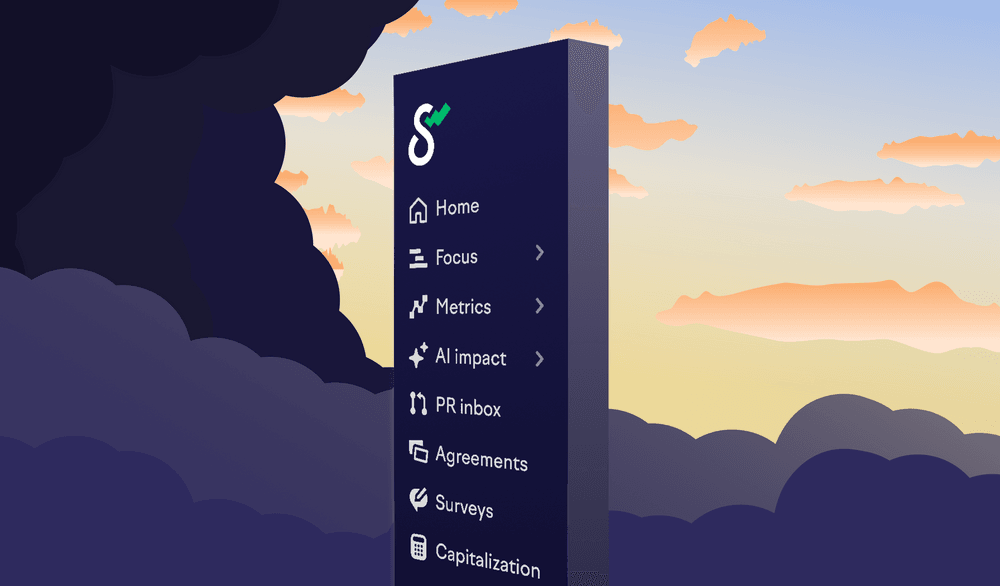
We’ve reorganized Swarmia’s navigation to make features easier to discover. Related metrics and views are now grouped together, so you can find what you’re looking for without hunting through menus.
What’s changed?
The new navigation groups related features into collapsible sections:
Focus brings together views that show how engineering time is spent:
- Focus summary
- Investment balance
- Initiatives
- Work log
- Sprints
Metrics consolidates all your productivity metrics:
- Code
- DORA
- Issues
- CI visibility
AI impact is a top-level section with its own views:
- Adoption
- Activity
- Impact
Other features like surveys, agreements, pull requests, and software capitalization remain easily accessible in the main navigation.

Getting started
The new navigation is now live for all Swarmia users. Your existing bookmarks and links will continue to work — we’ve simply made features easier to find.
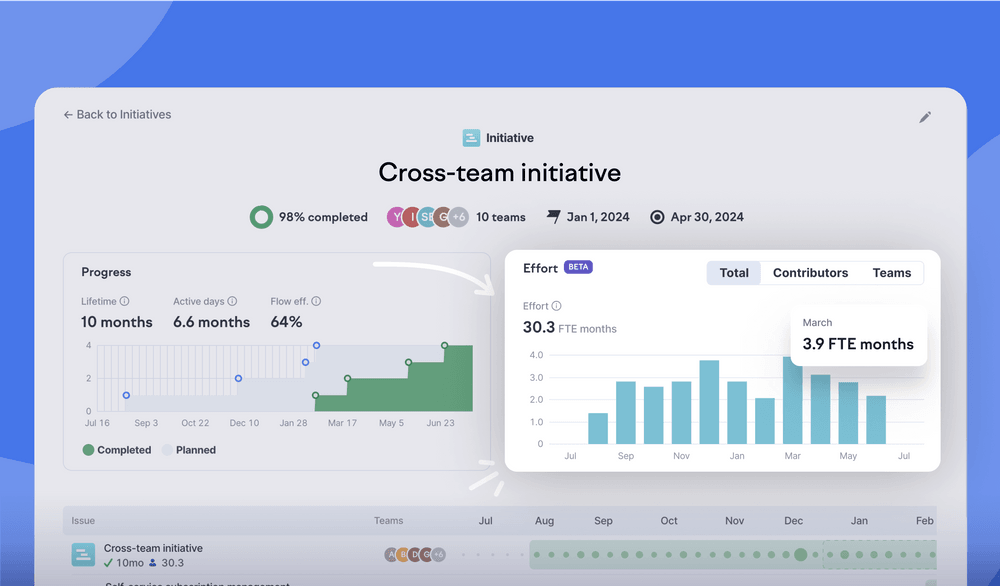
Understand team contributions with the new initiative breakdown
Cross-team initiatives can involve dozens of people working across multiple teams. Before diving into individual work items, you need to understand the bigger picture: which teams are actively contributing, how much effort each has invested, and how their work is progressing.

The new breakdown gives you that top-level view. When you open an initiative, you’ll now see a breakdown by team that shows:
- Progress and remaining scope for each team
- Effort and how it’s trending
- Individual contributors
This makes it easier to spot patterns and understand how work for an initiative is distributed across your organization. For example, you might notice that one team has moved on while another is still actively contributing, or that a team has added significant new scope that wasn’t originally planned.
From the team breakdown, you can filter the work timeline to focus on a single team’s issues, or switch to the work tab to see the timeline across all teams.

To try it out, navigate to any of your initiatives in Swarmia.
Compare pull request metrics by AI coding assistant
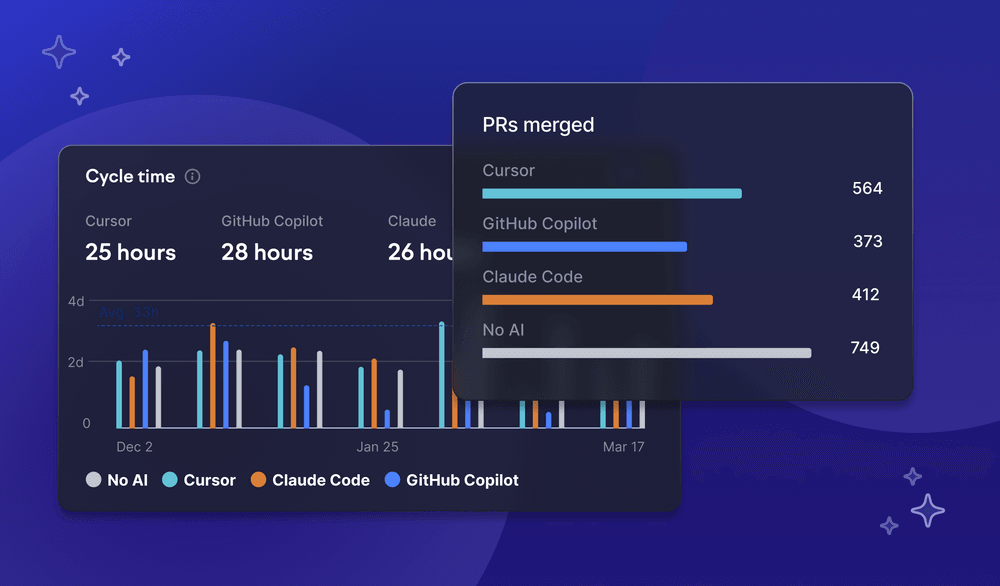
You can now see how pull requests assisted by different AI coding tools — or no AI tools — perform across metrics like throughput, cycle time, batch size, and review time. You’ll find this and all the AI adoption, activity, and impact views under the new AI impact section in the main navigation.
When you connect GitHub Copilot, Cursor, or Claude Code to Swarmia, we automatically tag pull requests as AI-assisted if any of their commits were made by an AI tool or by someone who was active on an AI tool. The new comparison view, available at AI impact → Impact, brings all this data together in one place, so you can see patterns without jumping between tabs.
Use the aggregate selector to view averages, or choose from various percentiles to reduce the effect of outlier pull requests. You can also apply filters like repository to understand where AI-assisted work differs from other work.
This makes it easier to answer questions like: Is AI-assisted work moving through your system faster or slower? Which teams benefit most from AI tools? How are quality indicators responding to increased AI usage?
To get started, connect your AI coding assistants in settings → AI assistants.
Speed up developer workflows with Microsoft Teams notifications (beta)
You can now use Swarmia notifications in Microsoft Teams to boost your team’s work and improve collaboration without switching between tools.
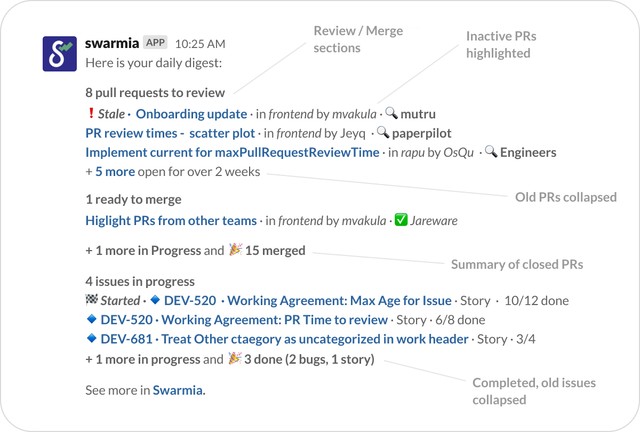
Daily digests give your team a summary of pull requests, issues, and surveys that need attention. They also help you automatically follow the working agreements your team has set up in Swarmia, so everyone stays on top of them without manual check-ins.
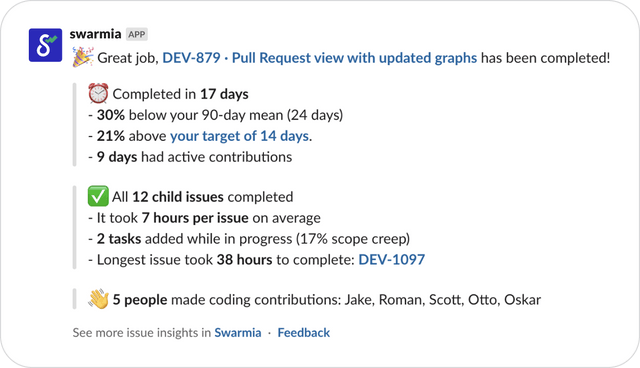
Issue summaries are delivered to your team’s channel when you complete a larger issue. They include the most important metrics, such as cycle time and scope creep, and prompt you to take a moment to reflect and celebrate wins.
Pull request notifications help get your code shipped faster by pinging the right person or team as soon as you request a review from them. You also get personal notifications from comments on your pull requests and can reply and react to them directly in Teams.
More notification types are coming soon, including pull request merges, mentions, and failed CI checks.
To get started, enable Entra SSO in Swarmia and follow the instructions at settings → Microsoft Teams to set up the integration.
Track AI-assisted pull requests
Understanding AI’s impact on your team’s work can be tricky. For example, if AI helps developers write code faster, they might create larger pull requests, which could actually slow down the review process.
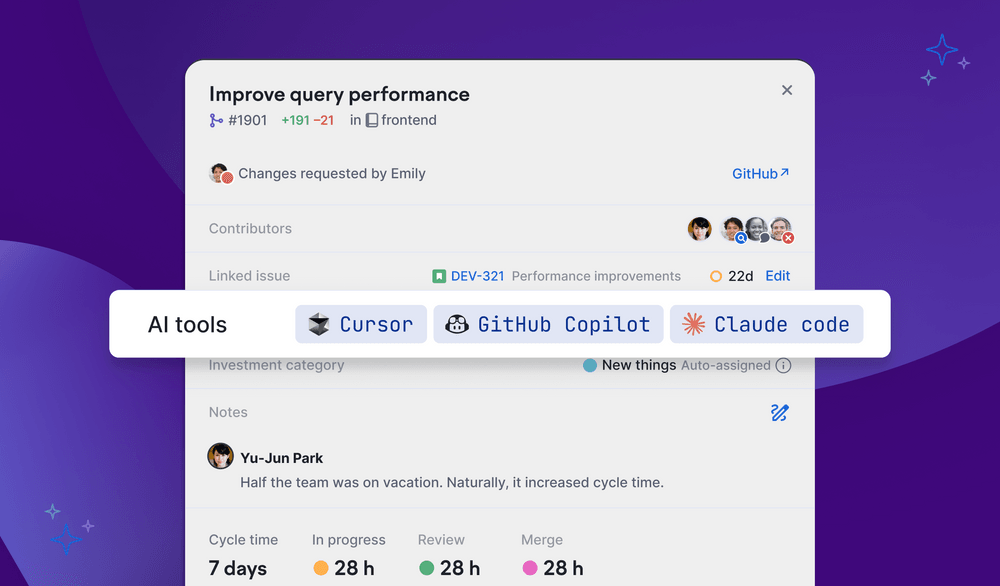
Swarmia now automatically detects pull requests assisted by GitHub Copilot, Cursor, or Claude Code. This helps you understand how using AI affects developer productivity metrics, such as pull request cycle time, throughput, and batch size.
A pull request is considered AI-assisted if any of its commits were made by an AI tool or a human who was active on an AI tool. You can see which AI tools assisted in an individual pull request by opening it anywhere in the app. To see the effect on metrics, you can filter pull requests in cycle time and batch size insights based on the AI tools involved.

To get started, connect GitHub Copilot, Cursor, and/or Claude Code to Swarmia in settings → AI assistants.
More updates
With our latest updates, you can:
- See Jira/Linear issue type in issue details popup. This gives you additional context when you use more granular issue types in your issue tracker.
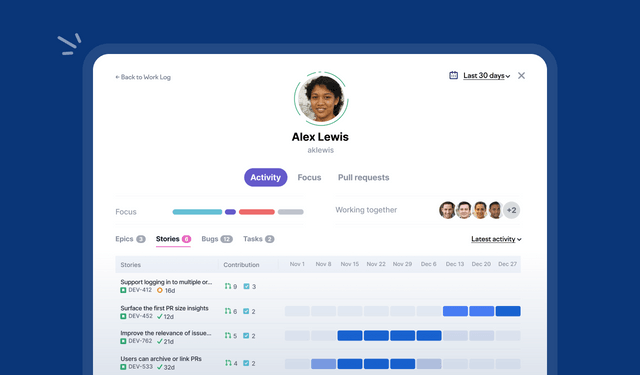
- Highlight an author in the work log. This makes it easier to see every team member’s contribution.
- Toggle to exclude uncategorized from investment balance. This makes it easier to analyze breakdowns that don’t categorize all work.
Create shared views in initiatives
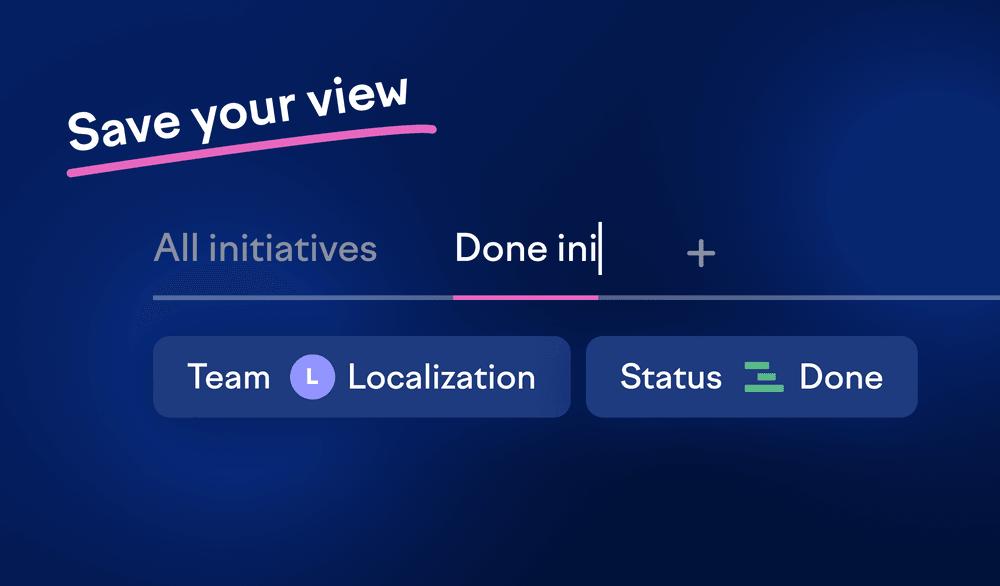
You can now save a set of filters as a shared view in the initiatives overview. This makes it easy to keep an eye on the initiatives that matter most to you and share curated views with your teammates.
In the initiatives overview, you’ll see two system views: active initiatives and all initiatives. To create a new view, set the filters you want and click the plus icon next to the tabs. Give your view a name, and it’s ready to use. Opening a view will always reapply the filters you’ve saved for it.

This is particularly useful when you’re tracking initiatives with upcoming deadlines. You can filter them and save the view, so you can check on them daily without having to apply the filters again.
To get started, navigate to initiatives and click the plus icon to create your first shared view.
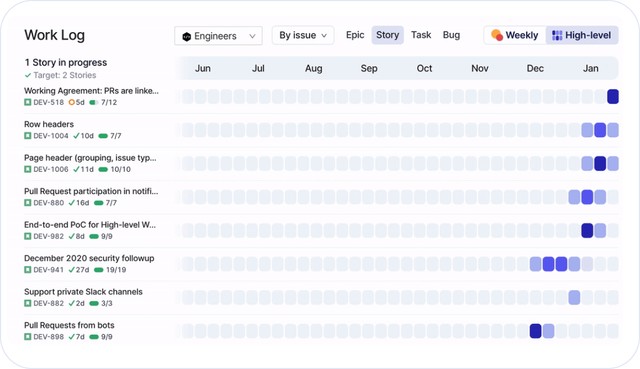
See time off in the work log
Ever waited for a teammate at a daily standup, only to remember they told you two weeks ago they’d be out?
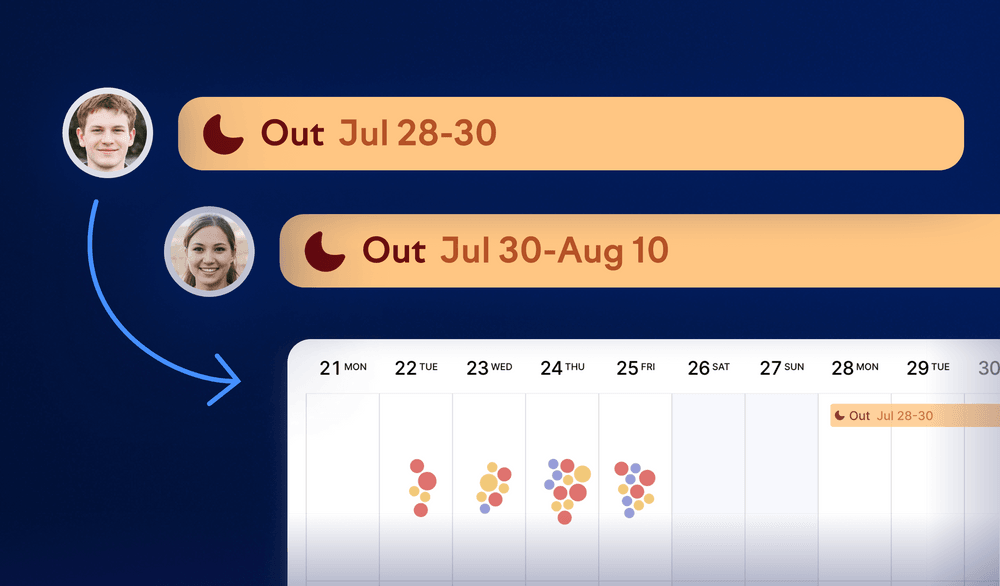
You can now see time off directly in the work log. When you group by author, yellow annotations show when team members are away. This helps you understand activity patterns without pinging colleagues while they’re out.
This is especially useful during daily standups, retrospectives, or when checking in on your team. Instead of wondering why someone hasn’t been active, you’ll see at a glance that they’re taking time off.
To get started, navigate to the work log and group by author. The feature is available for organizations that have connected their HR system or uploaded time off data.
Better effort tracking for development-adjacent work
Your engineering team does more than just write code. Bug investigations, planning sessions, testing, and other development-adjacent work are crucial parts of the software development process, but they often go untracked because they don’t generate Git activity.
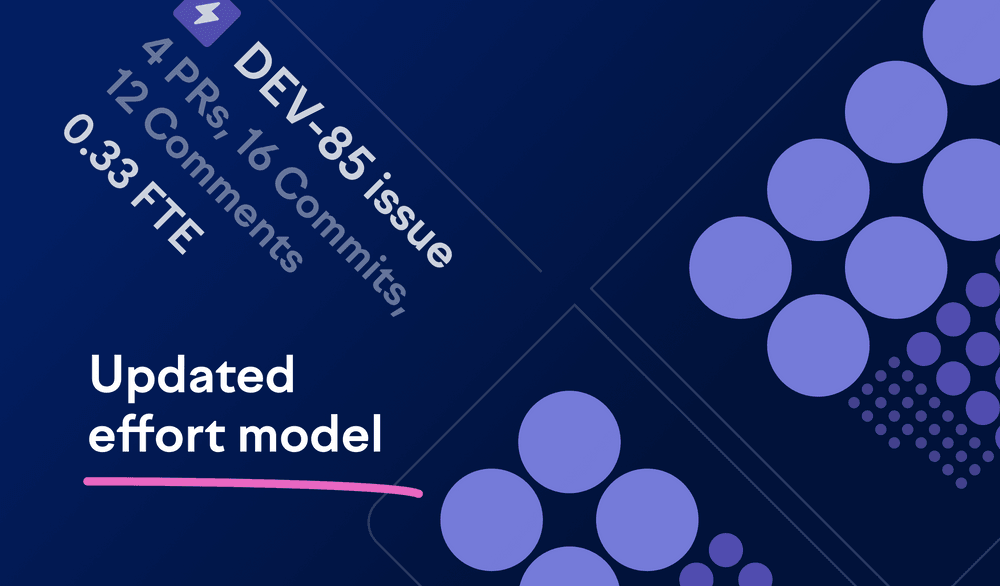
We’ve now introduced a new event type called issue progress days to our effort model, making it possible to assign effort to work that isn’t associated with Git activity. This means Swarmia can now capture a more complete picture of where your team’s time is spent.

How it works
Once an issue is assigned to someone and set to in progress, Swarmia starts counting that as daily activity for as long as the issue remains in progress. This new activity type gets included in our effort calculations alongside Git commits, comments, and pull requests.

The change is particularly valuable for allocating effort to tasks like:
- Bug investigation and troubleshooting
- Project planning and research
- Manual testing and quality assurance
- Security audits and compliance work
What you’ll see
For most developers, the impact won’t be dramatic. For contributors who handle significant amounts of code-adjacent work, you’ll notice more accurate effort allocation. You may see the biggest changes when drilling into specific issues that previously showed no effort or very little effort, such as quality assurance and security tasks.
The model change is visible in every view that uses effort (FTE), including investment balance and software capitalization. This gives you a more complete view of how your team’s time is distributed across different types of work.
If you’d like to generate capitalization data using the previous model for any reason, please reach out to us.
Track Claude Code adoption and use in Swarmia
Introducing AI tools like Claude Code is one thing — getting your teams to actually use them is another. To help you bridge that gap, you can now track Claude Code adoption and activity patterns directly in Swarmia, along with your GitHub Copilot and Cursor data.
In metrics / AI assistants, you’ll see user-level Claude Code licenses and daily activity data across teams and time periods. This gives you a quick overview of who has access to the tool and how actively they’re using it.
For deeper analysis, navigate to insights / Claude Code and select any team to see:
- Accepted and rejected tool action proposals over time
- Number of lines changed by Claude Code
This visibility helps you spot where Claude Code is catching on and where further guidance may be needed. It helps you tell whether people are just experimenting with the tool or actively relying on it in their daily work, notice patterns in how action proposals are being used, and identify unused licenses.
To start tracking Claude Code usage, you’ll need a Claude organization admin to create a Claude Code Admin API key. Once you have it, copy the key to the AI assistant settings in Swarmia.
The integration is currently available only if you’re authenticated through the Claude Console (the default option). If you’re using the Claude App or setups deployed via third-party cloud providers, please reach out to hello@swarmia.com.
Use Jira linked issues in initiatives and filters
You can now define how linked work items should be included in your Swarmia initiatives. This makes it easier to track cross-team work, especially if you’re using Jira Plans (previously Advanced Roadmaps) or Jira Product Discovery.
Links in initiatives
In initiative settings, you can now define which types of linked items get included. These items will be shown the same way as child issues, so your Jira Plans initiatives are reflected in Swarmia as you’d expect.
For example, if you’re using “is implemented by” links to connect work across teams, you can now include those linked issues in your initiatives to get a complete picture of the work involved.

To get started, navigate to initiative settings to configure which link types should be included in your initiatives.
Links as filters
You can also use links as filters anywhere in Swarmia. Find the new linked issues filter in the additional issue filters and then select the link type and issue key to surface related work.

This is useful when you want to see all issues blocking a specific epic, or find all issues that relate to a particular story. It’s just the first step, we'll be looking at more ways to incorporate linked items into Swarmia’s views.
More updates
- You can now filter issues by reporter. This is useful if you want to see how much effort has gone to all the bugs you’ve reported.
- You can now see the full list of contributors in focus summary. The new contributors panel sums up all individuals from the results in the table.
- You can now see both Jira/Linear and Swarmia statuses in the issue details popup and page. This gives you additional context when you use more granular statuses in your issue tracker.
- You can now change timeframe for the issue timeline inside the initiative view. This makes it quicker to load long-running initiatives and easier to zoom into a specific time period.
New access control roles: viewer and team admin
You can now use two new roles to control who can edit Swarmia settings in your organization: viewer and team admin.
The viewer role is perfect for team members who need visibility into engineering work but shouldn’t make configuration changes. Viewers can access all insights and reports (excluding software capitalization) but can’t manage teams, configure team settings, or create working agreements or initiatives.
The team admin role is intended for team leads and managers who need to configure settings for their specific teams without needing full admin access to the entire organization.
As part of the update, the current member role is renamed to editor to reflect the broad permissions better. No existing user permissions were changed.
These new roles make it easier to give the right level of access to everyone in your organization without having to worry about accidental changes to your Swarmia setup.
To assign the viewer role to users, navigate to settings → teams & members → roles. To assign team admins for specific teams, go to settings → teams & members → open a team.
Reorder investment balance breakdowns
You can now reorder your investment balance breakdowns and change which one is primary. Simply drag and drop the breakdowns in settings → investment categories to reorder them. The first breakdown in the list becomes your primary breakdown.
Your primary breakdown is shown across Swarmia whenever you’re viewing investment balance data or categorizing work. This makes it easy to emphasize the lens that matters most to your organization — whether that’s the Balance Framework, key initiatives, product areas, or something else entirely.
Changing your primary breakdown doesn’t result in data loss. Any manual categorizations you’ve made are retained for both issues and pull requests.
Use Microsoft Entra ID single sign-on (SSO) to manage Swarmia access
You can now use Microsoft Entra ID authentication to manage your organization’s access to Swarmia. This is especially useful if you’d like to invite non-engineers, like the leadership team, product managers, designers, or finance team members.
Once you’ve logged into Swarmia with your Microsoft Entra ID credentials, anyone in your organization can log in using Microsoft Entra ID single sign-on (SSO) — no GitHub account needed. If you’ve been using GitHub authentication until now, your team members will be automatically migrated to Microsoft Entra ID SSO the next time they log in.
If you’d like to enable Microsoft Entra ID SSO for your organization, you can contact us at hello@swarmia.com or get in touch with your account team to get started. You can also read more on our help center.
Automatically import initiatives from Jira
Managing initiatives in Swarmia just got a whole lot easier. We now support automatically syncing initiatives from Jira. If your organization tracks high-level projects in Jira, you can set up Swarmia to automatically display them in the initiatives view, making sure you always have real-time visibility into strategic engineering work.
Define what gets imported
You can customize which Jira items become initiatives in Swarmia using the same flexible filters you’re already familiar with from other Swarmia settings. By default, we import issues where the Jira type is “initiative,” but you can adjust this based on your Jira setup.

For example, if you use labels like “strategic” or “Q1-priority” to identify your most valuable projects, you can set up filters to automatically import any epic or story with those labels as initiatives.
Getting started
Navigate to initiatives settings to enable automatic import. For existing customers, this feature is toggled off by default to avoid unexpected changes to your current setup. Once enabled, Swarmia will continuously sync your initiatives based on your filter criteria.
This update is especially valuable if you're managing 10 or more active initiatives and want to skip the manual updates.
More updates
- You can now see the effort trend for issues in the focus summary.
- Effort will now be attributed to teams based on team membership. This means that individuals changing teams will not alter the historical FTE values for a team.
See all your initiatives at a glance with the new overview
Managing multiple cross-team engineering projects can feel like juggling in the dark. You know there’s a lot happening, but getting a clear picture of where everything stands requires digging through different boards and tools. Swarmia’s newly updated initiatives overview gives you instant visibility into project progress and team focus.
Track how projects evolve over time

Static project lists don’t tell the whole story. The new monthly trend breakdowns reveal how your projects are actually progressing:
- Completion trends help you understand whether a project has stalled or if the scope is expanding. If completion isn’t moving but effort continues, you might be dealing with scope creep that needs addressing.
- Effort trends show when teams are ramping up or moving on to other work. You’ll quickly see if a project is just starting, in full swing, or winding down — and spot when teams shift their focus between initiatives.
Find exactly what you’re looking for with filters
When you need to see specific projects, filters adapt to how you work:
- Timeframe filter: See only projects that were active during your selected period.
- Team filter: Zoom in on a specific team to see which initiatives they’ve contributed to, where they have work remaining, and where they’re currently focusing their effort.
These filters work together to answer critical questions like “What did the platform team work on last quarter?” or “Which initiatives are currently active across all teams?”
Getting started
If you’re using initiatives in Swarmia, the new overview is already available. Just navigate to initiatives to explore it. Use the time filter in the top right corner and the filters above the table to customize your view. Try different filter combinations to see how they affect the effort and completion metrics for each project.
Track AI assistant activity patterns with detailed GitHub Copilot and Cursor insights
Rolling out tools like GitHub Copilot and Cursor is just the first step in incorporating AI into your engineering work. If you want to see real productivity gains, people need to build new habits and learn to use these tools effectively. That requires visibility into how your teams are actually using them.
Now you can see detailed activity patterns for GitHub Copilot and Cursor across your organization. Track engagement levels, understand where AI suggestions are gaining traction, and identify teams that might need extra support. You can also evaluate different AI tools to make informed decisions about which ones deliver the most value.
What you can see
Daily engagement charts show how many of your active users are accepting code suggestions. This helps you understand whether people are just trying out the tools or actively relying on them in their work.
Activity volume charts display the number of suggestions and acceptance rates over time, giving you insight into how much your teams are using AI assistance.
GitHub Copilot insights include breakdowns by editor and programming language, so you can spot patterns in how different tools and codebases benefit from AI suggestions.
Cursor insights show activity across different modes (agent, chat, and ⌘K/Ctrl+K), helping you understand which features resonate most with your teams.
Getting started
Check that GitHub Copilot and Cursor are connected in settings → integrations → AI assistants, then navigate to insights → AI assistants to explore activity patterns for each tool.
Import time off periods with a CSV file to improve data accuracy
Getting accurate full-time equivalent (FTE) data is essential for investment balance insights and software capitalization. But what if you can’t connect your HR system to Swarmia? Now you can import time off data directly from a CSV file, making it easy to maintain accurate effort calculations regardless of your HR setup.
When you’re doing business-critical reporting such as software capitalization, every detail counts. Time off periods directly impact your FTE calculations, which determine how much engineering effort goes into capitalizable work. Without accounting for vacations, sick days, and other time away, your capitalization reports could overstate the actual effort invested in new features versus maintenance work.
Get started

Navigate to settings → integrations → HR system and select the data import tab. Upload your CSV file, and Swarmia will automatically process the time off records and adjust FTE calculations across all your insights. Our documentation provides the CSV format requirements and best practices for preparing your import file.
More updates
- Swarmia now maintains a complete history of team membership changes. This means pull request counts, cycle times, and deployment metrics stay consistent even after team changes, improving accuracy when comparing team performance across different time periods.
Invite team members to Swarmia via Slack
You can now invite team members to Swarmia directly through Slack. When you invite someone this way, we automatically enable their personal GitHub-Slack notifications — the main way individual engineers interact with Swarmia. This means they’ll start getting helpful notifications about their pull requests, code reviews, and CI failures without any additional setup.
Here’s how it works
You can invite any team member who hasn't already signed up or been previously invited. Admins can invite anyone in the organization, while team members can invite their own teammates.
Once you preview and send the invitation, recipients get a friendly message in Slack and can choose to sign up for Swarmia or opt out of notifications.
To get started, click “invite members” on the home page or team settings, and select “invite via Slack.”
More updates
- Our updated export API now allows you to export monthly engineering effort data (FTE) to CSV, making it easy to share with finance teams that might not have access to Swarmia. You can group by custom Jira fields or issue hierarchy for precise software capitalization reporting.
Keep pull requests small with a batch size working agreement
Smaller pull requests are easier to review, ship faster, and introduce less risk. But it’s hard to maintain good habits without visibility into how you’re actually doing.
You can now create a working agreement to limit pull request batch size in your team. When someone opens a PR that exceeds your agreed limit, you’ll know about it — making it easier to course-correct and maintain momentum.
Here’s why smaller pull requests are better
- Faster, better reviews: Engineers tend to postpone reviewing large PRs. And when they do start, code review fatigue can set in — resulting in superficial reviews instead of thoughtful feedback.
- Protected flow: Smaller PRs mean smaller tasks, which require less context to hold in your head. This makes it easier to get back into flow after interruptions.
- Reduced risk: Working in small increments helps prevent scope creep and makes it easier to hand work over to teammates when needed.
Getting started
First, get your team aligned on keeping pull requests small, then:
- Navigate to Agreements / Explore / Limit pull request batch size
- Set your maximum lines changed per pull request (we recommend starting with 500)
- Make sure your team’s daily Slack digest is enabled to help you stay on top of your new agreement
Like all working agreements in Swarmia, this helps you build better habits through better visibility and gentle nudges. You can adjust the limit any time as your team finds its rhythm.
More updates
- You can now create new topics to organize your custom questions in developer experience surveys.
- By installing our new Jira app, you can limit which Jira projects you grant Swarmia API access to, instead of connecting everything and filtering in the UI. This is similar to GitHub’s own setting for limiting what repos an app can access.
- Your focus summary now shows total available effort for selected teams, making it easier to compare how much effort went into specific work versus what was available overall.
See investment balance breakdown for sprints
Do you have a good grasp of what goes into your sprints? Are your sprints mostly focused on building new things or something else?
Now you can answer these questions instantly with investment balance breakdowns for sprints in Swarmia.
In the sprints view, you'll now see investment balance breakdowns for each sprint. Completed and ongoing sprints show the breakdown for completed issues, while planned sprints display the breakdown of all issues assigned to that sprint. When you drill into a single sprint, you can see the breakdown for both current scope and completed work. You can also toggle between issues and story points to get the view that works best for your team.
This makes it easier to discover patterns in what type of work is scoped and completed in your sprints. For example, you might notice trends like an increasing share of KTLO within sprints. You can also use these insights to help plan future sprints according to your investment balance goals, like maintaining 80% focus on building new things.
To get started, simply navigate to the sprints view in Swarmia.
More updates
- Linear Project labels are now supported in Swarmia, bringing consistent labeling across issues and projects. Easily filter and categorize your projects using the label field you already use for issues.
Track Cursor adoption and activity in the AI assistants view
We now support Cursor in Swarmia’s AI assistants view. If you’re using Cursor and GitHub Copilot, you can now see both tools side-by-side and track adoption patterns across your engineering teams.
Tracking the adoption and usage of AI coding tools is an important part of measuring their productivity impact. With Cursor insights, you can see the people with a Cursor license and the average active users each week across your teams.
Once you have AI adoption data flowing into Swarmia, you can analyze it alongside your existing engineering metrics to understand how AI tools are affecting your teams. Compare cycle times and throughput between teams with different adoption levels, monitor pull request sizes to maintain review quality, and track collaboration patterns to avoid knowledge silos. Swarmia offers built-in AI tool questions with links to system metrics to help you analyze adoption and engineering effectiveness together.
How to get started
Get your Cursor admin to create an API key and copy it to Settings / AI assistants in Swarmia. Once connected, navigate to Metrics / AI assistants to see your organization’s adoption trends.
More updates
- If we can’t automatically find all your team members from Slack, you can now easily map the remaining people when you’re creating a survey to ensure you reach everyone with reminders.
- You can now add open-ended questions to surveys.
- You can now see a PR batch size p90 trend chart in Insights / Code / Overview.
- AI assistant metrics now list the individual users who have a license.
Define hotfixes with pull request and issue filters for more accurate change failure metrics
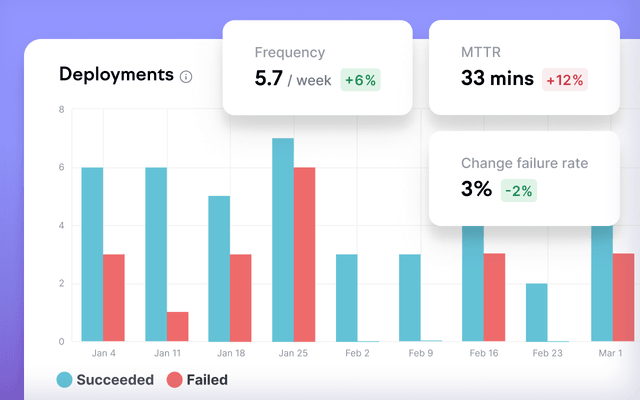
Change failure rate and mean time to recovery are two of the four key DORA metrics, helping you understand how often your deployments cause problems in production and how quickly you can restore service when failures occur. A high change failure rate usually means your release process needs work — but measuring it accurately can be tricky.
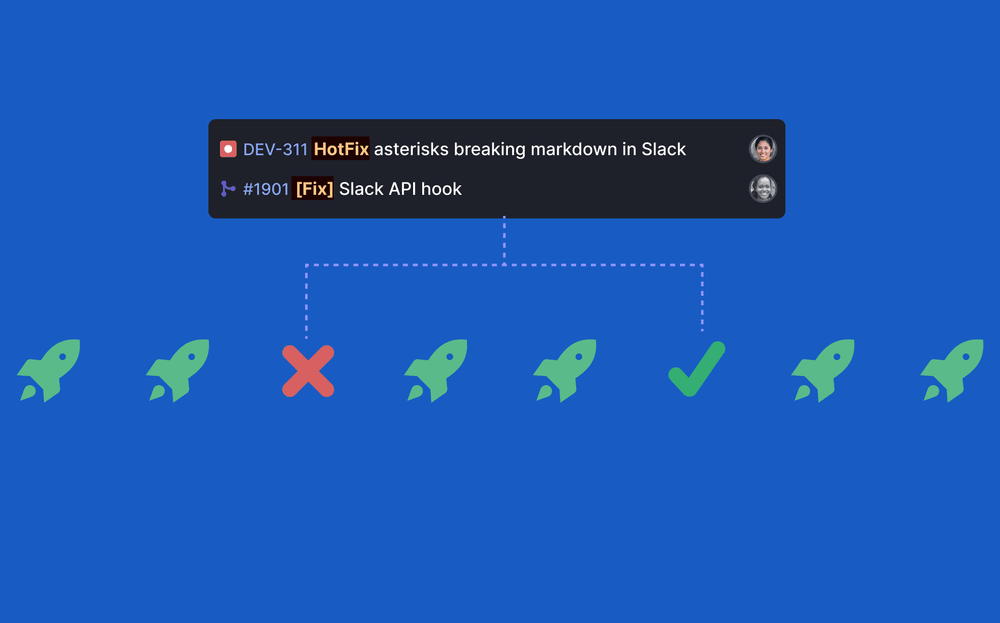
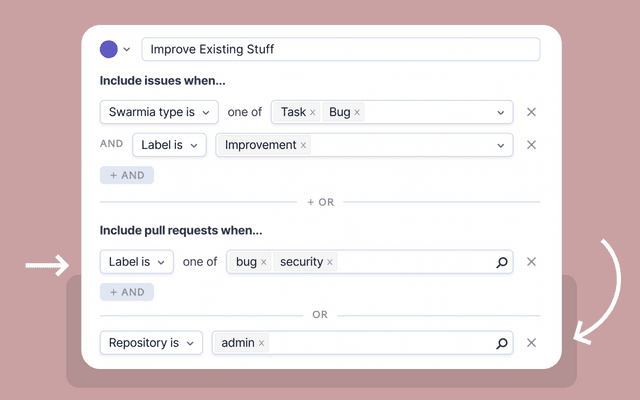
Now you can use pull request and issue filters to define what counts as a hotfix in Swarmia. This gives you more control over change failure rate calculations and helps ensure the metric reflects your team’s actual fix patterns.
How it works
Configure filters that match either pull requests or issues (based on title, labels, or custom fields). When a deployment includes a PR or issue that matches your configured filter, Swarmia considers the related deployment as a fix. When a deployment contains a hotfix (based on your filters), Swarmia automatically marks the previous/matching deployment as a change failure.
This approach works well for teams that already use consistent conventions for tracking fixes — like prefixing hotfix pull requests with “hotfix:” or using specific labels like “bug” or “urgent-fix.” Read more about automatic hotfix detection.
Getting started
You can now configure these filters directly in the UI. Navigate to Settings → Deployments → Hotfix detection to set up your pull request and issue filters.
Add context to pull requests and issues with notes
Sometimes numbers only tell a part of the story. A pull request might have taken longer than usual due to unexpected complexity, scope changes, or external blockers. An issue might be an outlier for reasons that aren’t obvious from the metrics alone.
Now you can add manual notes to pull requests and issues to capture that missing context. These notes help your team understand what really happened behind the metrics.
How it works
In Swarmia: Click on any issue or pull request to open the details popup. In the notes section, you can view previous notes or add your own.
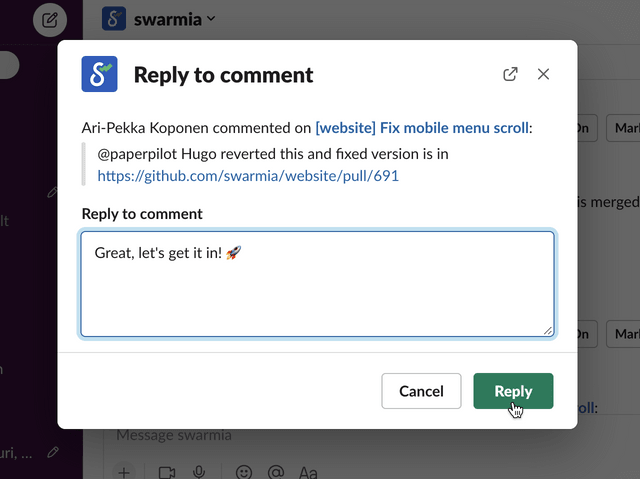
In GitHub: Mention @swarmia in a pull request comment, and it’ll automatically be added as a note in Swarmia.
Why you’ll find this useful
Adding context to long or unusual pull requests and issues can help your team in retrospectives, reveal patterns, and build shared understanding even for those not directly involved in the work.
We’re starting by gathering this data to understand which insights will be most valuable to you. This is just the beginning — more improvements are on the way.
Try adding a note to your next pull request or issue to see how it works.
Simplify software capitalization reporting
Software capitalization helps you automatically categorize engineering efforts as either capital expenses (CapEx) or operating expenses (OpEx) and generate reports for your finance team. Now, this feature is available to all Swarmia customers on the Standard and Business Outcomes plans.
With software capitalization in Swarmia, you can:
- Automatically identify capitalizable work using the same flexible rules you already use for investment categories.
- Generate reports for your finance team without bothering engineers with manual time tracking.
If you’ve used Swarmia for software capitalization before, you’ll see some recent improvements. You can now preview capitalization data in real time to ensure accuracy before sharing it with others. The UI provides a way to inspect capitalizable effort by work item and contributor.
How it works
- Define your capitalization rules using issue filters (custom fields, labels, or initiatives).
- Preview your capitalization data by work item or by contributor.
- Make final adjustments by excluding specific work items or contributors from your reports.
- Export monthly and annual reports for your finance team.
Setting up capitalization in Swarmia only takes a few minutes, and it uses the data you already have in your issue tracker.
Get started
For most, software capitalization will be critical at the end of the financial year, but it is good to familiarize yourself with the feature already. You can start by defining capitalization rules with your finance team, ensuring you have one less thing to worry about once the busiest time of the year rolls around.
To get started, navigate to capitalization in the main navigation (available to Swarmia admins only). If you need help setting up your capitalization rules or have questions about the feature, reach out to us via the chat or email hello@swarmia.com.
More updates
- The built-in AI tools survey questions now have industry benchmarks, allowing you to understand where your organization stands when it comes to AI adoption and use.
Track GitHub Copilot adoption and activity across your organization
AI coding tools like GitHub Copilot can significantly boost developer productivity, but how do you know if your investment is paying off? Now you can track GitHub Copilot adoption and usage across all your teams over time.
See how many developers have GitHub Copilot enabled versus how many are actively using it in any time period. This makes it easy to spot adoption trends, identify teams leading the charge, and find unused licenses that might need attention.
You can also compare Copilot adoption against trends in productivity metrics. Are teams with higher adoption seeing faster pull request cycle times? Are they keeping batch sizes in check? Is collaboration increasing, or are more people working alone?
Use the insights to evangelize successful practices from early adopters to teams still getting started. Or identify unused licenses — maybe it’s time to invest in training or stop paying for seats that aren’t being used.
We’re adding support for other popular AI coding tools like Cursor soon to give you a complete view of AI tool usage across your organization.
To get started, navigate to Metrics / GitHub Copilot in Swarmia and grant read access to GitHub Copilot Business. You’ll get access to data from this point onward (no backfill of historical data).
Link more pull requests with smart issue suggestions
Ever merged a pull request only to realize later that you forgot to link it to an issue? We’ve all been there. Now, Swarmia has your back with smart issue suggestions that make linking easier than ever.
When you merge a pull request that isn’t linked to an issue, the Swarmia Slack bot will now suggest relevant issues based on your pull request details. The suggestions are powered by AI that analyzes your PR and issue metadata to find the most likely matches.
Why this matters: Linking pull requests to issues gives you a complete picture of your work. Without these links, Swarmia can only show data from your issue tracker, missing all the coding activity that actually happened. With better linking, you get deeper insights into cycle times, scope changes, and team collaboration patterns.
Getting started: These smart suggestions work automatically if you have personal notifications enabled and your team has adopted the “link pull requests to issues” working agreement. The bot will send you suggestions right in Slack, so you can link your work without losing momentum.
Try it out on your next unlinked PR and see how much easier it is to keep your work connected.
Find patterns in your work with AI-powered issue grouping
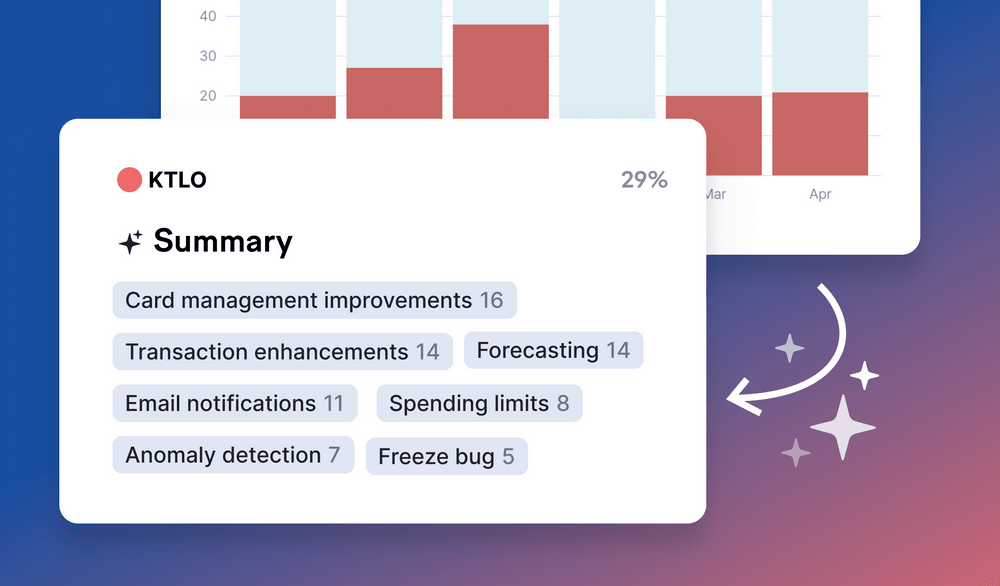
Swarmia now supports automatically grouping similar issues together so you can identify common themes without the manual work.
Our new issue grouping feature analyzes issue content, linked pull requests, and parent issues to find patterns that might otherwise go unnoticed. This is especially helpful for bug fixes and reactive work that doesn’t have consistent labeling — but might be pointing to deeper quality issues in specific areas.
How to get started:
- Navigate to the investment balance view and select a team
- Choose an investment category
- Click the new “summarize” button to automatically group issues by theme
- Toggle themes on or off to filter the issue list and focus on specific patterns
For example, you might discover that what looks like a random collection of bug fixes is actually revealing recurring problems in your authentication system, payment processing, or API integrations — giving you the insights you need to make targeted improvements.
This feature is available to users in all organizations that have allowed the use of OpenAI as a subprocessor for their data.
Faster sprint views and new drill-downs
The sprints view in Swarmia is now faster and offers even more insights. With the latest updates, you can quickly jump from analyzing long-term trends to drilling into what’s happening during each sprint.
What’s new
- Major performance improvements. These are especially noticeable if several teams in your organization are using sprints.
- New sprint drill-down. Click any sprint in the chart to see all its issues with story points.
- Story points in timeline. You can now see the progress of story points in the activity timeline for each sprint.
The new drill-down makes it easy to inspect what happened in each sprint. You can filter to see planned issues, scope increases, and carryovers separately. Issues removed from the sprint are shown in their own section, giving you the full picture of sprint changes.
Get started
If you’re already using sprints in Swarmia, you’ll notice the performance improvements and new drill-downs immediately.
Not using sprints yet? Head to team settings, toggle on “track sprint activity,” and select the Jira board you’d like to pull sprints from.
Get a bird’s-eye view of issue metrics across your organization
Running a large engineering organization can be hard. While team-level metrics give you detailed insights, sometimes you need to step back and see the bigger picture.
Our new issue metrics view gives engineering leaders a comprehensive overview of how work flows across the entire organization. Now you can:
- Track key metrics like completed issues, cycle time, and work in progress across all teams.
- Understand how each team is doing relative to its headcount to identify teams that might need support.
- Filter by issue type to see how specific work items like stories or bugs flow through your organization.
- View metrics over time with customizable aggregation functions (median, average, p95).
These improvements bring more flexibility to how you analyze your engineering data. For example, you can now switch between average and median cycle times to get a more realistic view of typical performance, or use p95 to identify cases where you struggled, and could improve.
To get started, navigate to the new issues tab under metrics in the main navigation.
In the coming months, we’ll roll out more filtering options to this view, and extend capabilities like customizable aggregation functions to other parts of Swarmia.
See a more accurate distribution of work with the updated effort model
We’ve refined our developer effort model based on your feedback and extensive testing. If you’re using investment balance or software capitalization, you’re already familiar with FTE (full-time equivalent). It’s our way of showing how much time each developer spends on different tasks.
Here’s what’s new in the updated effort model:
- Smarter weighting for different types of work
- Automatic detection of inactive periods
- HR system integration for time off
Smarter activity weights
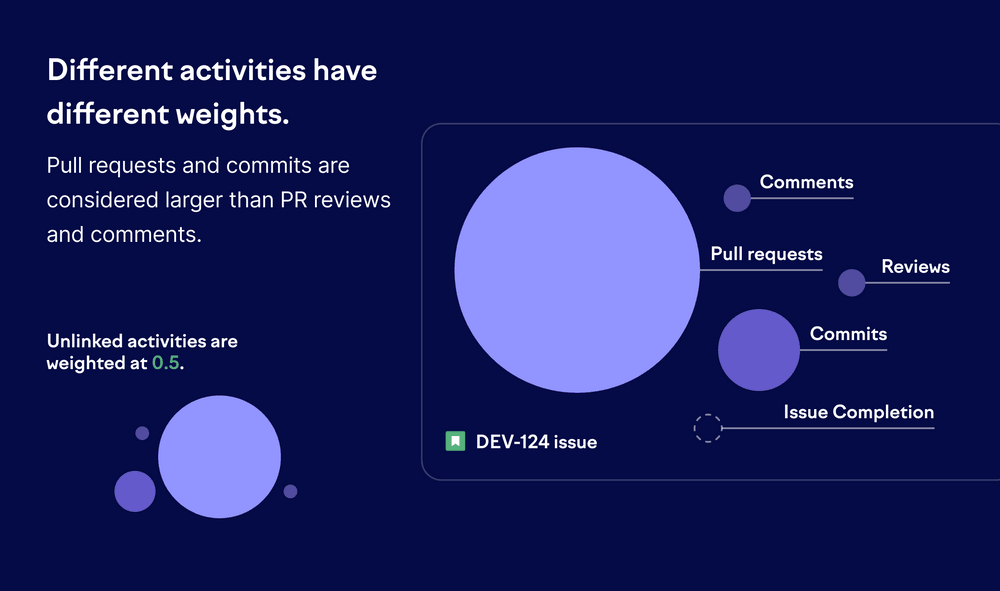
Not all contributions are equal, and our model now reflects that. Pull requests and commits are weighted more heavily than comments and reviews, and issue completions are no longer counted as activities for FTE.
Activities related to unlinked pull requests are also given much less weight than those tied to issues. The result? A more accurate representation of meaningful work.
In addition, all activities related to unlinked pull requests are now weighed significantly lower than those linked to issues.
Smarter handling of inactivity
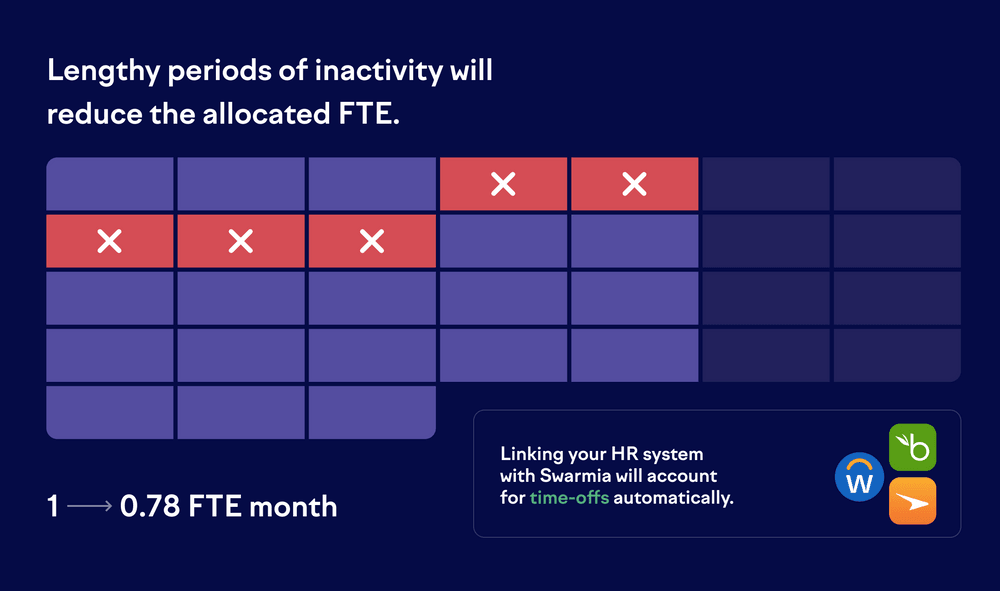
Each developer is still allocated 1 FTE per month, based on their activity. With this update, we’ll automatically detect extended inactivity and reduce allocated FTE accordingly.
Sync time off from your HR system
Want even more accuracy in how working days are counted toward FTE? You can now integrate your HR system with Swarmia. Any synced time off will automatically reduce a developer’s allocated FTE.
Read more about how to get set up and which HR systems we support.
What to expect
In most cases, you’ll see small shifts in FTE numbers. Typically, there is a slight decrease overall, with more effort being attributed to larger, issue-linked work. The model still evaluates each developer individually but with finer-grained logic under the hood.
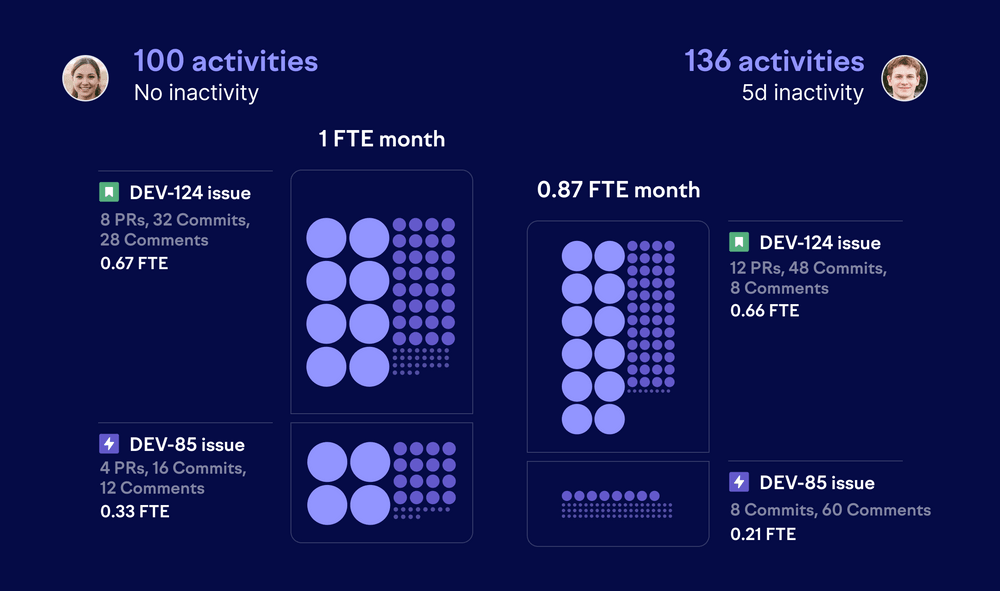
These changes will give you a more accurate view of where developers are putting their focus.
We’re continuously improving our effort model to make it more accurate, and we’ll likely announce more updates later this year. Contact us if you have any questions about the effort model.
Connect Swarmia with network-restricted systems using our new proxy agent
Our new proxy agent allows you to connect Swarmia with your on-premise GitHub Enterprise and Jira instances even when they’re not publicly accessible.
The lightweight proxy agent works by establishing secure outbound connections from within your network. It listens for webhooks from your systems, captures the data, and forwards it through a gateway to Swarmia. The best part is that it’s all done without requiring any inbound connections to your infrastructure.
This means you can:
- Maintain strict security policies and compliance requirements
- Keep your development tools isolated from public internet access
- Still get all the benefits of Swarmia
Ready to connect your network-restricted systems with Swarmia? Contact us at hello@swarmia.com to get started. We’ll guide you through the setup process and ensure a smooth integration with your existing infrastructure.
Let the right insights find you with signals
Ever feel like there’s so much information across your tools that it’s easy to miss important trends?
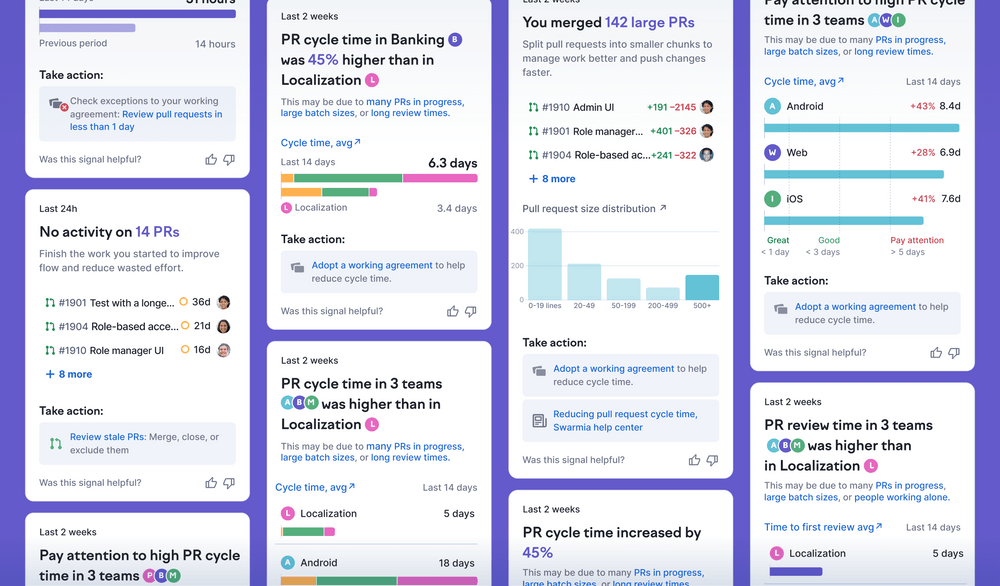
That’s why we’re launching signals, a new feature that proactively surfaces insights about your team’s work. Instead of you hunting for patterns, signals bring them directly to you, along with recommendations for what to do next.
Signals automatically detect:
- Anti-patterns like too much work in progress or people working alone
- Old or stale pull requests and issues that need attention
- Unexpected increases in metrics like cycle time
- Teams that are outliers compared to your organization’s average or Swarmia benchmarks
For each signal, we explain what happened, why it matters, what may have caused it, and suggest actions like adopting working agreements to prevent similar issues in the future.
Signals are shown on the Swarmia home page, and they also appear in team lists and relevant team views. You don’t need to do anything to set them up — if you’ve already connected GitHub and your issue tracker, signals work right out of the box.
Try it out today by visiting the Swarmia home page. If you have any feedback or ideas on how to make signals even more relevant for your organization, let us know by sending an email to hello@swarmia.com or contacting your customer success manager.
Automatically bring your Linear initiatives to Swarmia
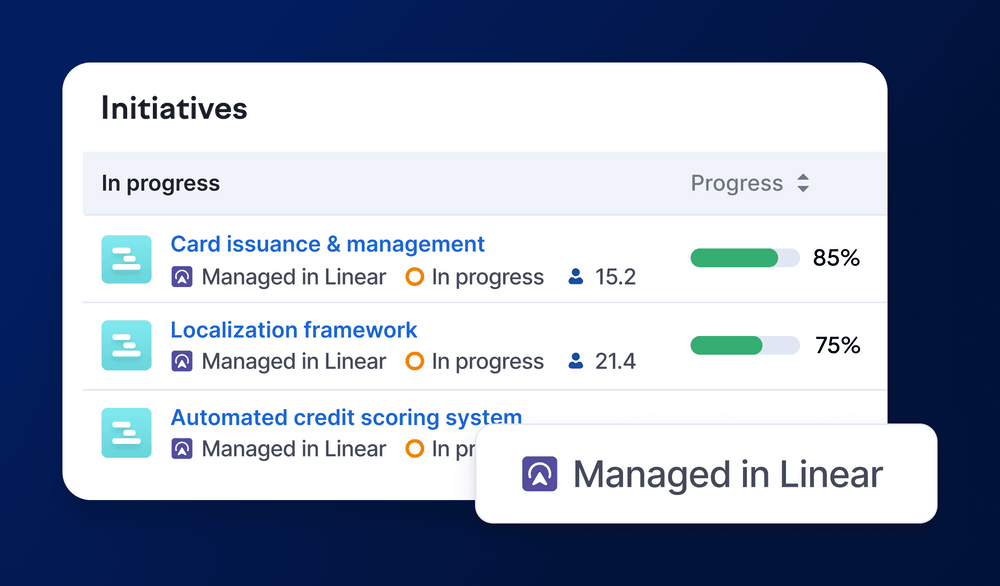
We now support Linear initiatives in Swarmia. If you’ve set up initiatives in Linear, they’re automatically imported to Swarmia’s initiatives view, making sure you always have real-time visibility into cross-team engineering work.
More updates
- You can now use initiatives to define capitalizable work.
- Similarly to any other issue filter, you can now use initiatives to filter data anywhere in Swarmia.
- We also added initiatives to search, making it easier to find what you’re looking for.
- If you’ve connected your issue tracker to Swarmia, you can filter pull requests based on whether they’re linked to an issue or not. This allows you to compare the cycle times between unliked and linked PRs.
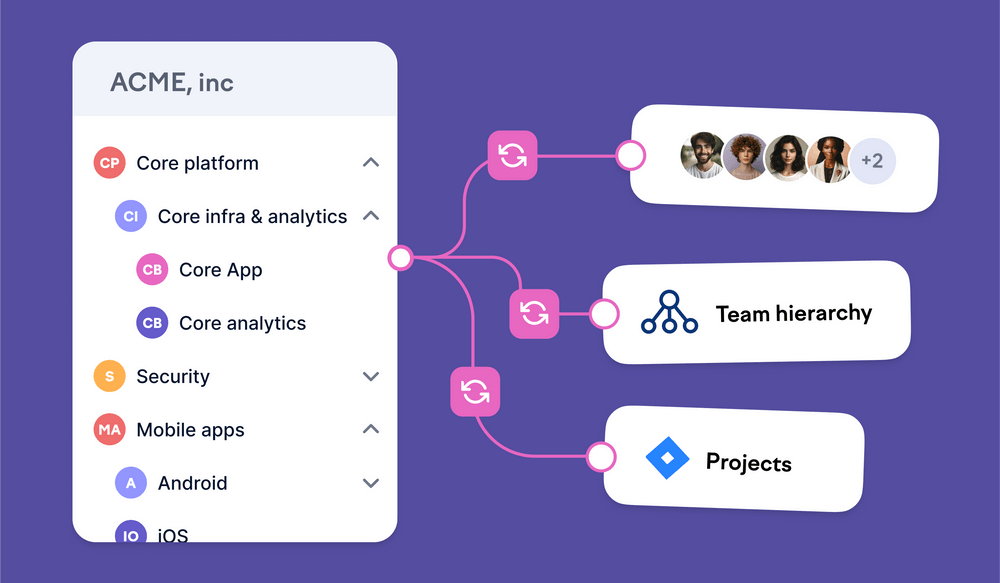
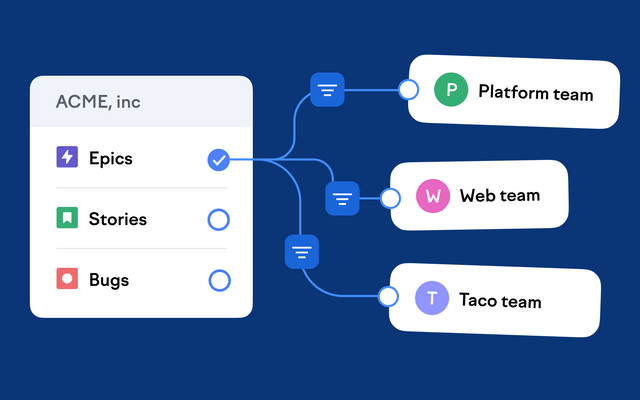
- You can now create Swarmia teams in bulk from GitHub. Simply select the GitHub teams you want to sync with Swarmia. All changes you make to your GitHub teams will be automatically reflected in Swarmia.
- We released a survey communication guide to help you improve the response rates of your developer experience surveys. Use the templates as they are or add your own spin to them to make the most of your next survey.
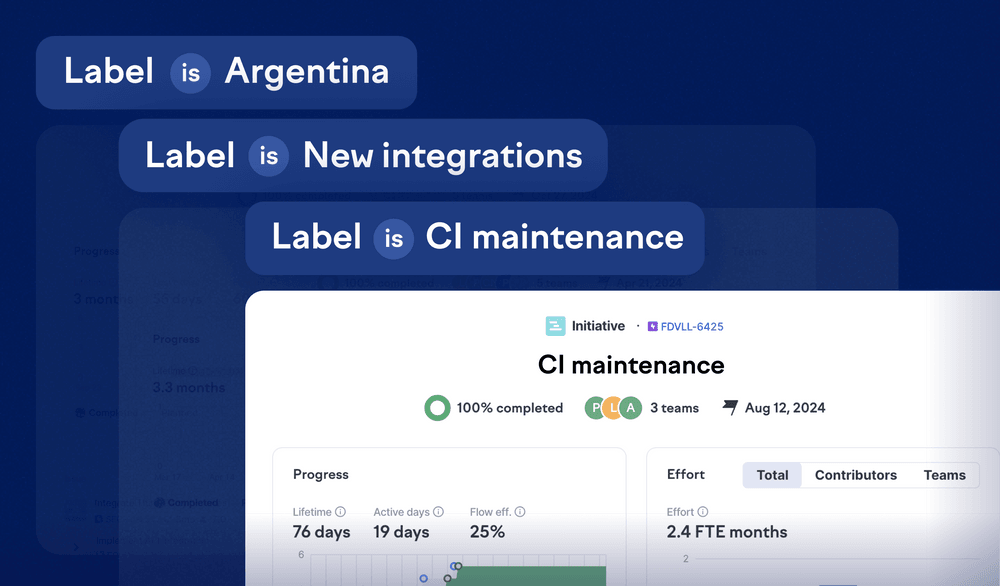
Create initiatives from labels and custom fields
You can now more easily create initiatives by using issue filters to add multiple issues at once. Instead of manually selecting individual epics, stories, or tasks, you can:
- Filter by labels, projects, or custom fields.
- Quickly gather all related tasks into a single initiative.
- Save time and reduce overhead when managing large sets of issues.
This update makes it faster to organize related work, so you can keep your projects moving. Try it out by navigating to initiatives and clicking add initiative.
Find things faster with search (⌘K)
Our new search makes it a whole lot easier to find things in Swarmia. You can access it from the navigation bar or hit ⌘K (Ctrl+K on Windows or Linux) to start searching from anywhere in the app.
Whether you’re looking for specific issues, pull requests, people, or views, just type what you need and jump straight to it — no more digging through menus or scanning insights to find them. Plus, with recent results, you can quickly get back to your previous items without starting from scratch.
Try it out by hitting ⌘K.
More updates
- You can now choose the weekdays you want to receive the Slack daily digest in settings → notifications.
- When responding to a survey, you can now see all your comments in a sidebar, so you can easily review everything before submitting.
Use Google single sign-on (SSO) to manage Swarmia access
You can now use Google authentication to manage your organization’s access to Swarmia. This is especially useful if you’d like to invite non-engineers, like the leadership team, product managers, designers, or finance team members to the app.
Once an admin has enabled Google SSO for your organization, anyone in the organization can log in using their Google Workspace credentials — no GitHub account needed. If you’ve been using GitHub authentication until now, your team members will be automatically migrated to Google SSO the next time they log in.
Read more about getting started with Google SSO.
Other updates
Over the past few weeks, we’ve also rolled out multiple smaller product improvements.
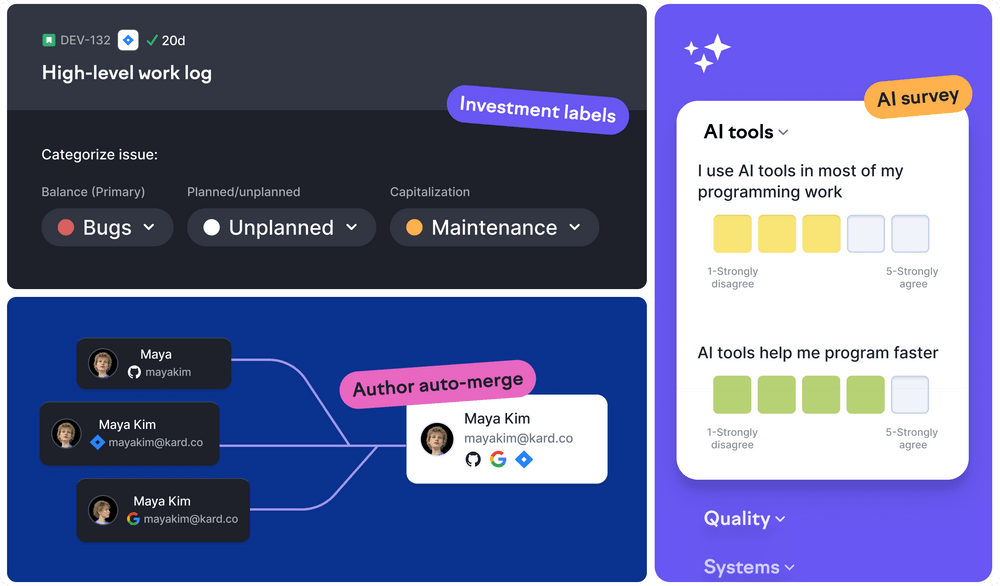
Improvements to developer experience surveys
- The questions in the new "AI tools" topic help you measure the adoption and impact of AI tools in your organization.
- Want to see which questions have changed the most since your previous survey? You can now use comparisons and sort by them on the questions & comments tab.
- Teams can now see live surveys and follow their response rates in the daily Slack digest.
Improvements to investment balance
- You can now filter issues by any investment category breakdown in flow and focus insights. Previously, filtering was limited to the primary breakdown.
- Similarly, when opening an issue in Swarmia, you can now manually apply a category from any investment breakdown.
- You can now filter by investment category, and apply other issue filters in the focus summary. This view helps you understand the biggest investments of a team overall or within a specific initiative and investment category.
- We’ve added a progress indicator to let you know when your investment category rule changes are being processed. Since these updates involve analyzing tens of thousands of data points, they can sometimes take an hour or more. Now, you’ll see when the changes are complete.
- You can now filter uncategorized work by team, making it easier for teams to reach uncategorized inbox zero.
Author merge suggestions now applied automatically
We now automatically apply high-confidence suggestions to merge author identities from different tools, significantly improving data quality and consistency. You can view and manage all contributor identities in settings.
Track change in your survey results and compare them with industry benchmarks
Developer experience surveys can generate a lot of data, leaving you to figure out where to focus. You probably want to know what’s a good rating for each question, which teams need the most support, and whether you’re going in the right direction.
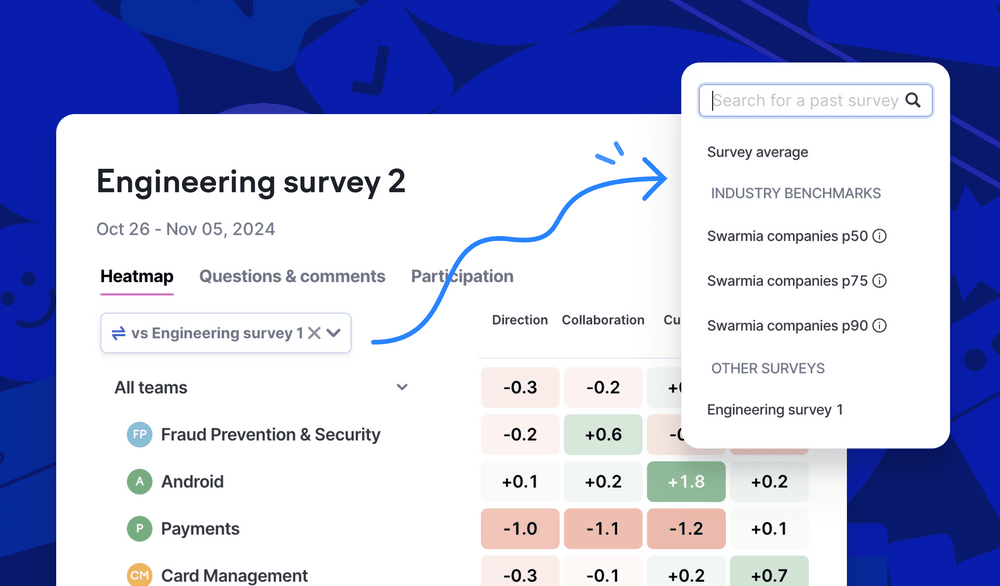
To help you with all of that, our survey results heatmap now has a new comparison mode with three options:
- Survey average: Easily see how much each team is above or below the survey’s average in each topic and question.
- Industry benchmarks: See how your results compare with Swarmia customers’ averages. You can choose from three percentiles: p50 (median), p75, and p90. The benchmarks are available for all of Swarmia’s 32 built-in questions.
- Another survey: Select any of your surveys and see the changes in scores between them. If some of the included teams or questions have changed between the surveys, we automatically include just the overlapping part in the comparison.
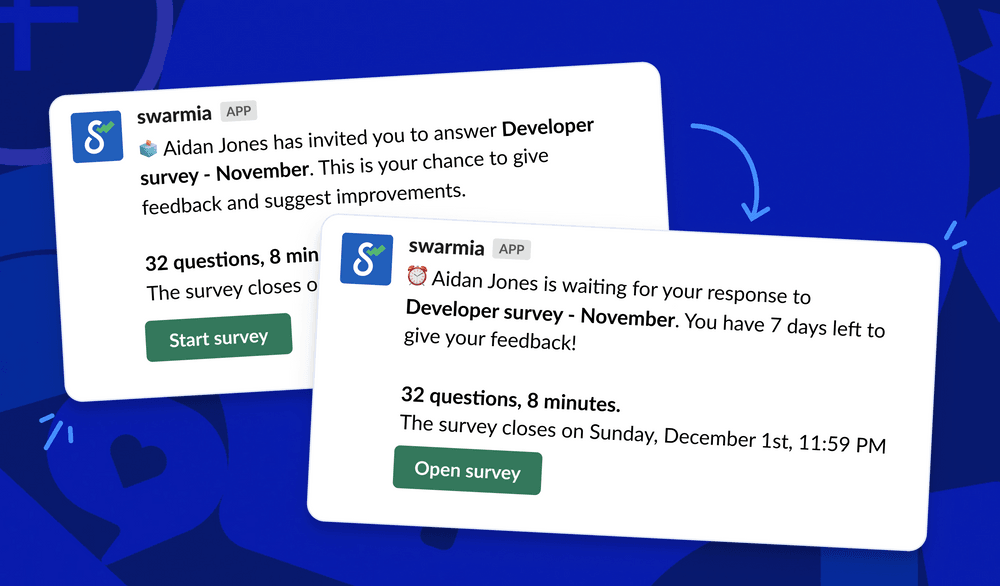
Get more survey responses with automatic Slack reminders
The more responses you get to your developer experience survey, the more accurate and useful the results will be. However, reminding people to reply shouldn’t be left to the managers and directors.
Swarmia now automatically sends Slack reminders to people who haven’t responded 7, 3, and 1 day(s) before each survey closes — no need to bother those who already filled out the survey.
As a survey creator, you’ll also get your share of useful notifications. For example, we’ll let you know when the survey closes, and the results are ready to be shared with the organization.
Discover how teams’ efforts are distributed with the new focus summary [beta]
Your team has OKRs, and you prioritize work, but how do you know how much of the team’s time goes into the top priorities? In the investment balance, you can see how balanced different types of work are, and in the work log, you can see every team’s detailed activity in two-week intervals.
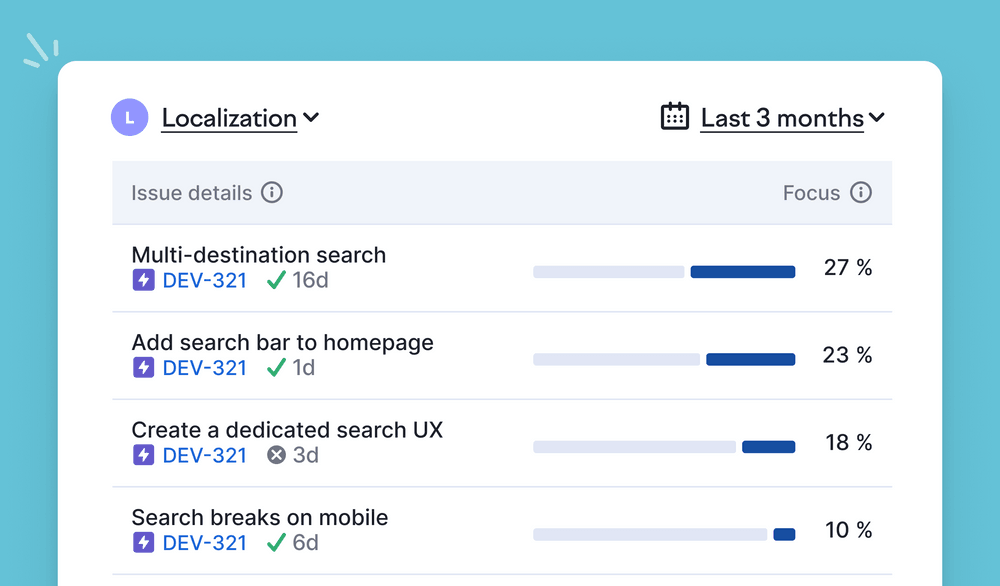
The new focus summary shows how much of a team’s effort goes to the top prioritized initiatives, projects, epics, and stories over the selected time period. It lets you explore what your teams are spending the most effort (full-time equivalent months or FTEs) on.
In short
The focus summary lists all the work a team has contributed to within the selected period. It sorts work based on focus, from highest to lowest.
Focus is the percentage of effort dedicated to a specific issue compared to the total effort (total amount of FTEs) for all issues and unlinked PRs within the chosen timeframe and team.
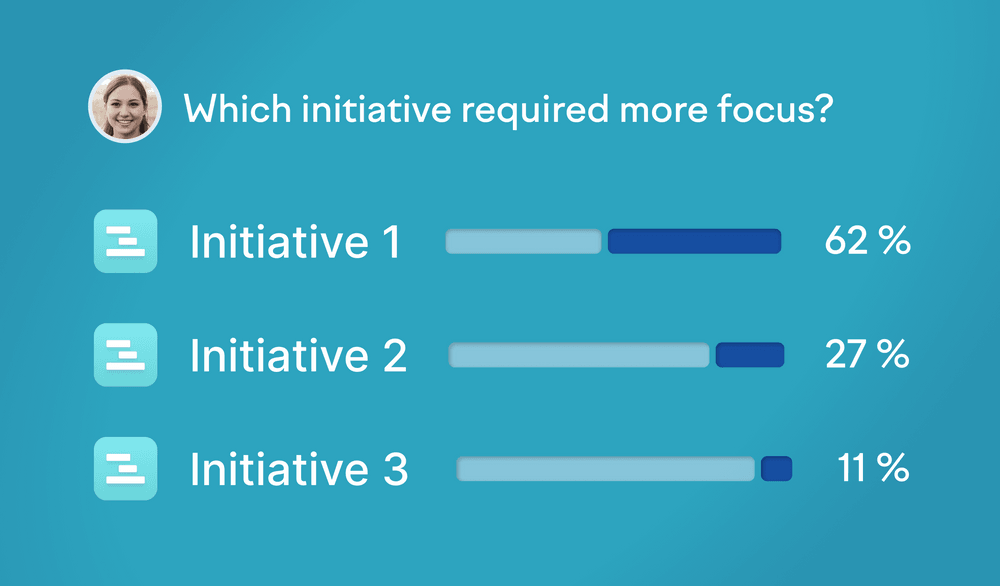
Focus on initiatives
To understand how much focus each initiative has taken, check the checkbox ’group by initiatives’ in the top right of the list; this will show initiatives alongside other issue types. It will group issues that belong to an initiative inside that initiative.
Next, from the initiative filter dropdown (next to the team selector), select the checkbox ‘all items.’ This will show you all your initiatives during the selected period and how the focus is divided between them. You can also select only a few initiatives at a time to see how they compare.
Find the focus summary from insights in the main navigation, and select focus summary from the second level navigation.
Tailor developer experience surveys to your needs with custom questions
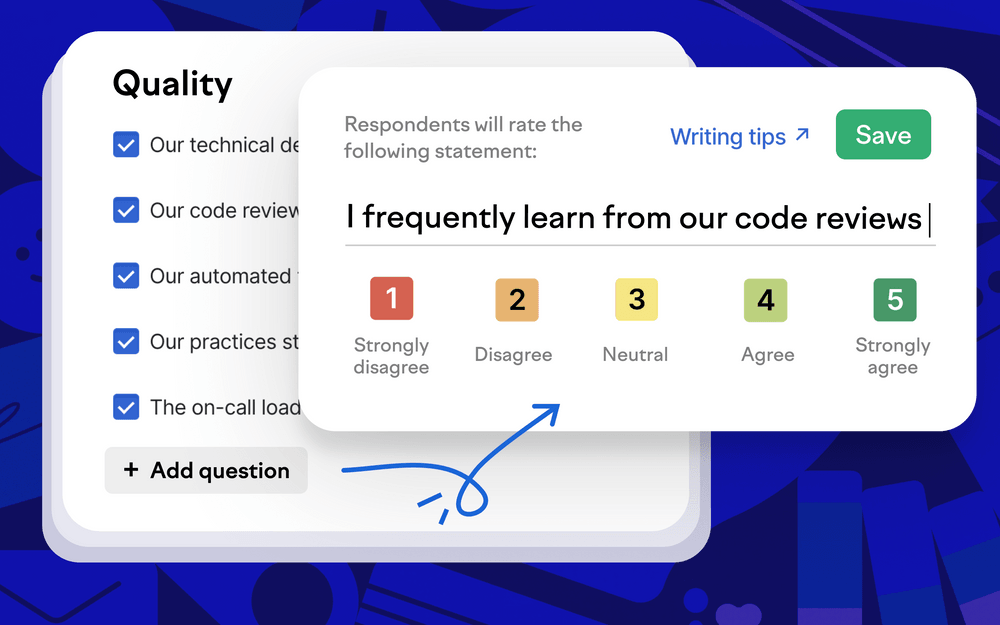
Swarmia makes it easy for you to run high-quality surveys with our set of research-backed questions designed for engineers. Now you can add your own questions to adapt the surveys to a wider range of situations and ask about things specific to your organization.
For example, you could ask about the custom scalar types in your GraphQL schema or how much value your engineers are getting from GitHub Copilot. Or you might design a full survey with several questions on cross-team communication.
The respondents see the custom questions the same way as the built-in ones. People can select how much they agree with each statement on a five-step scale and write comments. After the survey closes, you can use Swarmia’s powerful tools to analyze and share the results, take action, and drive change in the teams.
Beta: Analyze your investment balance with FTEs
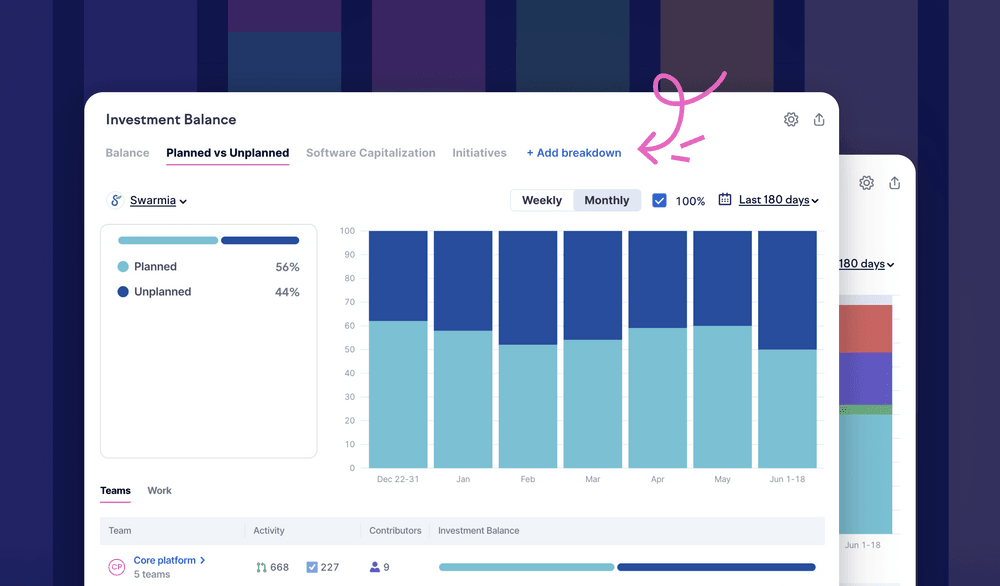
A few weeks ago, we announced the new FTE-based effort model for initiatives and issues. As of today, you can also choose to look at your investment balance through the effort lens. In the investment balance view, you’ll now see a toggle on top of the chart, allowing you to select either activity or effort.
Activity refers to the original model, which is based on activity on pull requests and issues grouped by investment category. It includes both completed issues and merged pull requests.
Effort describes the new model, which estimates developer effort in full-time equivalent (FTE) months by analyzing each developer’s activity across coding contributions, completed issues, and pull request actions (e.g., reviews, comments). Each developer is assigned one FTE month a month, which is divided across the tasks they contribute to. This data is then aggregated to estimate total effort on larger units like stories, epics, and initiatives.
During the beta phase, the activity model will remain the default. When toggling between activity and effort, you’ll likely notice minor differences in how work is distributed into the selected investment categories. This is partly because the effort model has a broader range of activity types than the activity model and partly because effort is normalized per developer.
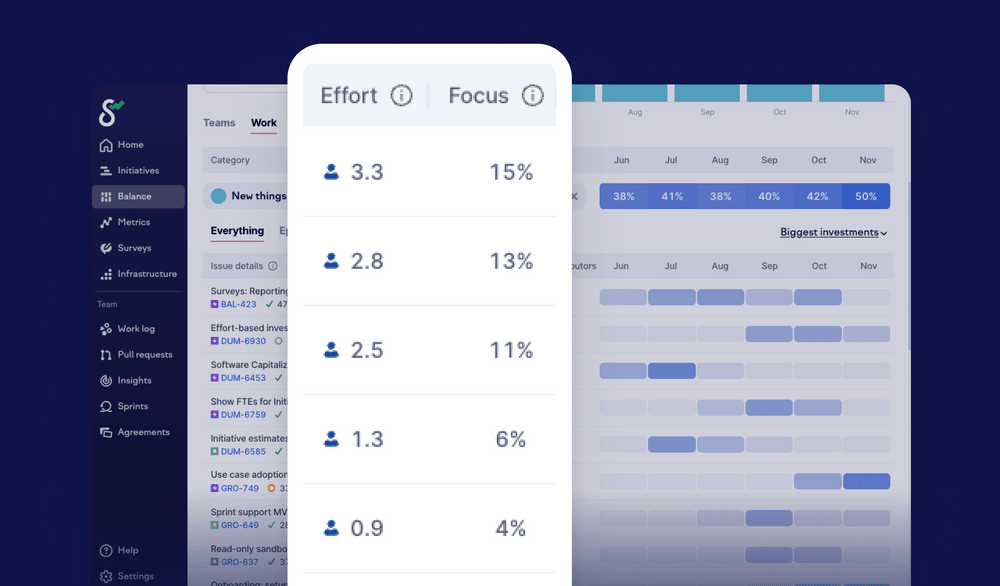
Exploring effort in the investment balance
Totals for investments
When viewing the investment balance in effort mode, you’ll still see your total investment categories broken down by percentage on the right side of the chart. If you deselect the 100% checkbox, you’ll see the investments broken down by total FTE months over the full period selected (the default is last 6 months).
Team size
Scrolling down to the table view under the chart, you’ll notice that the teams overview now has a new column for effort. Often you’ll see that the number of team members, contributors, and FTE months doesn’t match (e.g., seeing three months, three contributors, and six FTEs would suggest that one contributor has had no activities over the last three months).
Work
Probably the biggest upgrade to investment balance you’ll find under the work tab, or by clicking into a team, where you’ll see the list of investment categories. Clicking a category, e.g., new things, showcases a table of issues listed by the biggest investment. Here, you’ll now see effort (FTE months) and focus columns.
The focus column represents the percentage of effort dedicated to a specific issue compared to the total effort for all issues and unlinked PRs within the chosen time period. Now you can easily understand and compare how much effort and focus each of your largest investments within a category has taken.
To get started, simply navigate to balance in the menu and toggle on effort above the chart.
Track and analyze sprint activity in Swarmia
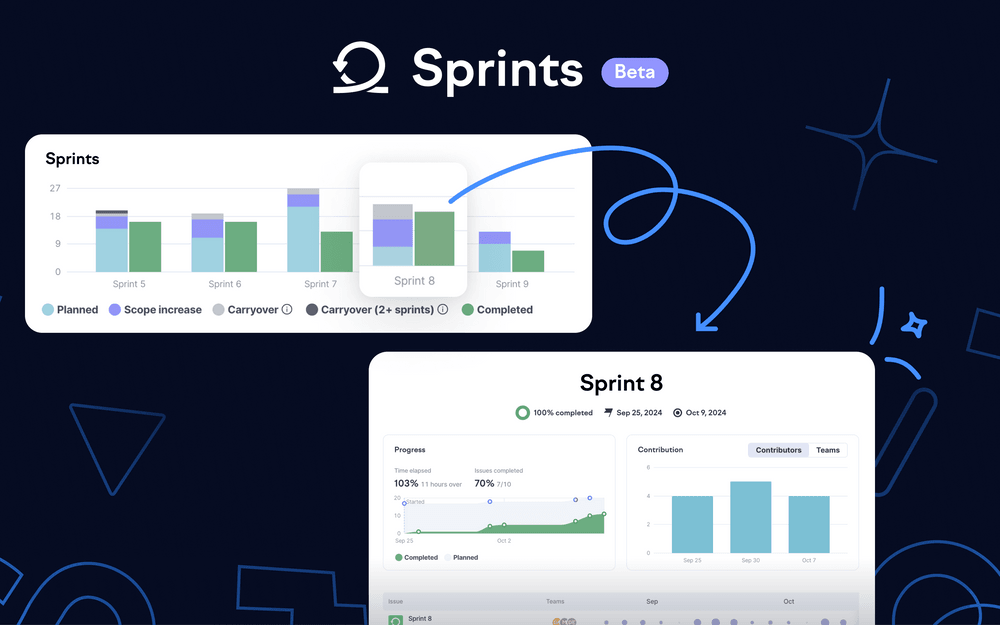
We designed Swarmia to adapt to each team’s unique way of working, whether they use Kanban, Scrum, or another framework. However, with this release, we take the Swarmia experience for Scrum teams one step further. Today, we’re introducing a new sprint view to help Scrum teams plan and analyze their sprint activity more effectively.
Now you can view all planned, completed, and ongoing sprints in Swarmia. For most teams, no setup is needed as we automatically select the team’s Scrum board.
In the sprints overview, you can track trends like total sprint scope, scope increases, carryover, and completion over time. For more detail, navigate to an individual sprint to see a full timeline of related issue activity and coding contributions. Here, you can also spot issues included in the sprint scope with no activity and those removed mid-sprint. You can also see who contributed to the sprint and explore related issue data, including cycle time, scope, and FTE (full-time equivalent) effort for each issue.
Sprints are currently in beta and available only to Standard plan customers using Jira. We’re eager to hear your feedback at hello@swarmia.com.
Dive deeper into metrics with related survey results
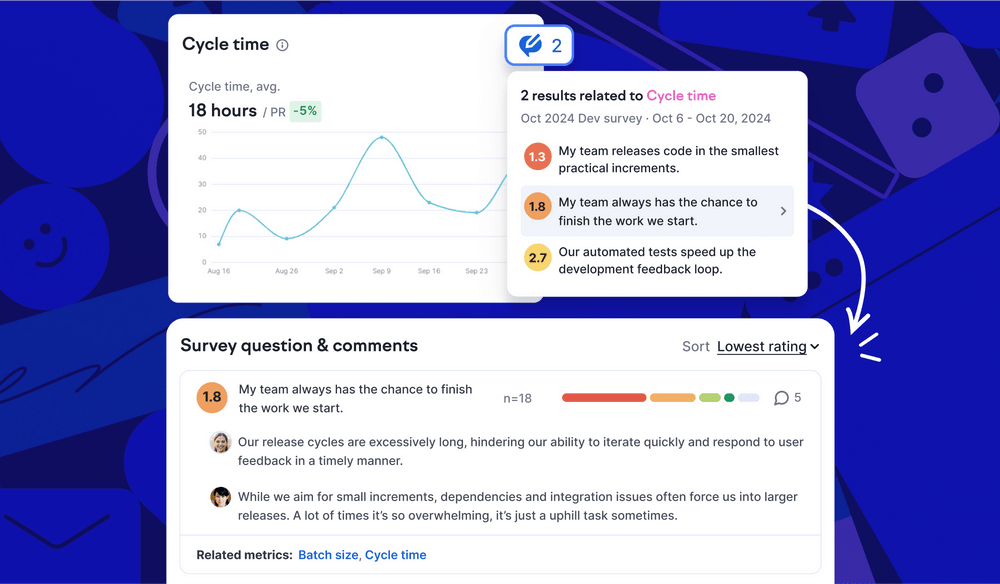
Developer experience surveys complement system metrics to give you a comprehensive view of what’s going on and how to improve. As we write on our blog, neither of these two types of data is inherently better, and you get the most out of each by combining them. Together they help you diagnose if your long epic cycle times are caused by interruptions, unclear priorities, or missing technical validation. Or you might learn whether technical debt or insufficient automated tests are causing your change failure rate to surge.
Now, you can see relevant survey questions right next to your pull request data, issue insights, and DORA metrics in Swarmia. Along with them, we show the latest survey results for the selected team to help you analyze everything in one place. To see the rating distribution and comments, simply click on the score to access the detailed survey report.
More updates
- You can now allow non-admins in your organization to create surveys. Contact us to enable this setting.
- Did you accidentally publish your survey results too soon? You can now unpublish them.
- Deployment apps using merged pull requests as their source now show more accurate data for GitHub merge queues.
- You can now choose to get notified when bots request reviews from your team.
Beta: Measure engineering effort with a new FTE-based model
Improving engineering effectiveness starts with understanding how time is spent across the organization and finding better ways to use it. By analyzing cycle time, project scope, and activity over time, you can gain valuable insights that help you plan work better and improve focus. Today, we’re introducing an even more comprehensive way to measure engineering effort across your projects.
The new model measures effort in full-time equivalent (FTE) months. To model effort, we analyze each developer’s activity timeline to evaluate where their time is spent across various activities, such as:
- Coding contributions
- Completed issues
- Pull request activities like reviews and comments
Each developer is allocated one FTE month per month, which is then distributed across the issues and pull requests they contributed to. This data is aggregated to provide an estimate of the total effort spent on stories, epics, and initiatives.
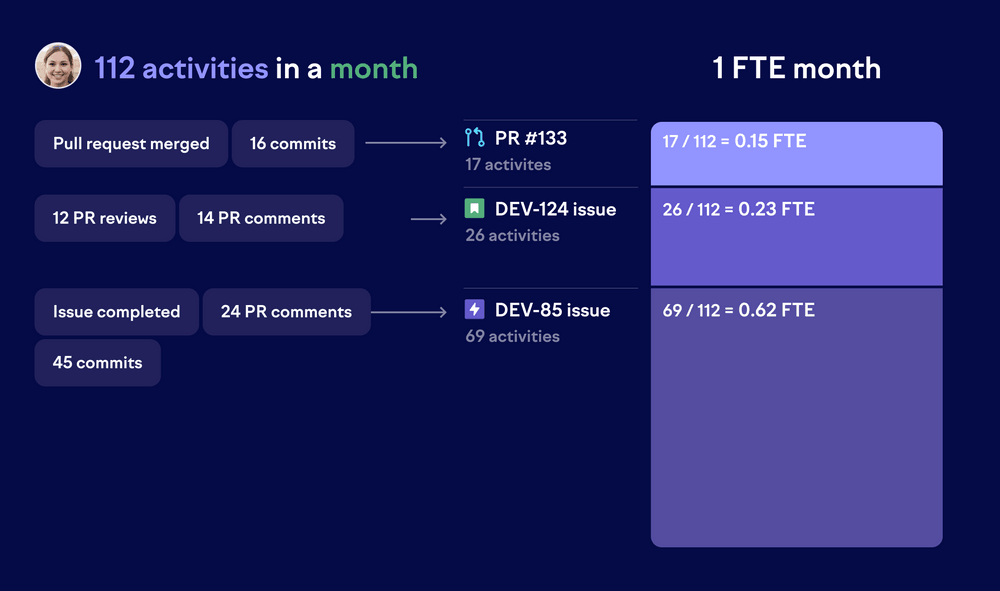
The advantage of this approach is that it considers hundreds of data points for each developer and accounts for different coding styles. In other words, it doesn’t matter whether you prefer many small commits or fewer, larger ones. Effort modeling is best seen as a complement to activity-based views, offering an additional perspective for comparing effort across projects.
You can already view total effort for individual issues and initiatives across the app, as well as month-over-month effort and a breakdown by contributor. In the coming weeks, we’ll introduce effort metrics to the investment balance and other parts of Swarmia.
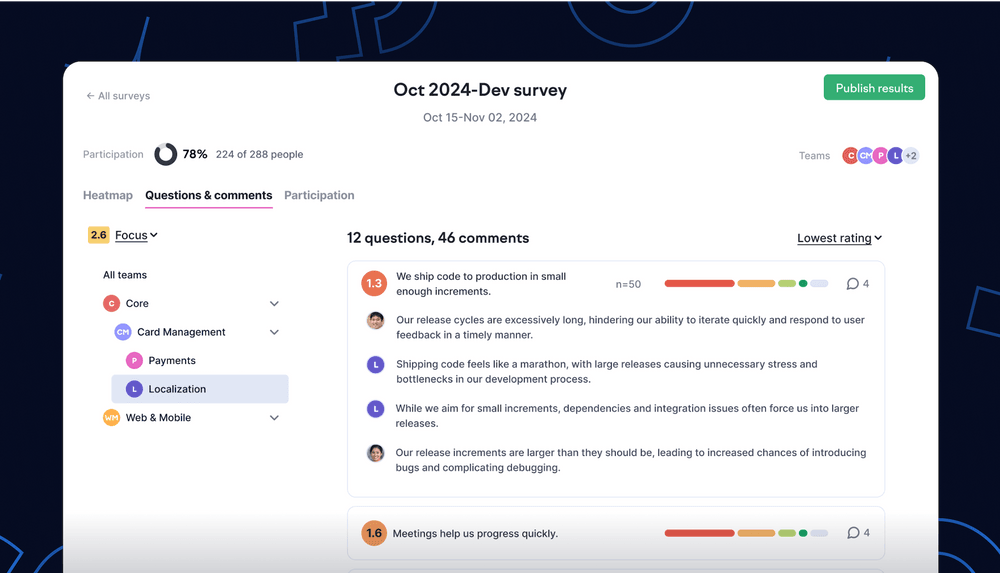
Unlock deeper survey insights with the new questions & comments tab
The new questions & comments tab in surveys is designed to help you analyze all survey feedback in one place. With it, you can view survey results in more detail, filter, sort, and take informed actions based on your findings.
Navigate to the questions & comments tab within a survey or click on the heatmap to view the details of a topic or question. Here’s what the new questions tab offers:
- Filter results by team: Analyze survey responses for your entire organization, or drill down into specific teams to see how their feedback compares.
- View rating distributions: For every question, see how responses are distributed across different ratings.
- Comments for every question: See the comments linked to each question to gain deeper insight into the reasoning behind the ratings.
- Sort by scores, most comments, and more: Sort questions by highest or lowest scores to quickly identify areas that need the most improvement. Find areas that generated the most discussion and questions that were skipped the most to refine your next survey. Insights from different teams help you prioritize actions in specific areas and drive targeted improvements.
The new questions & comments tab makes it easier than ever to find key areas for improvement. Soon, you’ll also be able to track changes in your organization’s feedback over time. Stay tuned!
Find what you're looking for in fewer clicks with the new navigation
Our new navigation makes it easier for everyone in the engineering organization to quickly access the tools and insights they need — whether you’re working in Swarmia daily or using it less frequently.
What changed?
1. Separation of team and organization features
The features are now better grouped, providing both organizational overview and team-specific perspectives. This lets you to quickly discover insights at any level you need.
2. New to the sidebar: initiatives and infrastructure
- Initiatives: Track cross-team activities and see organization-wide efforts in one view. This update lets you navigate to your initiatives faster.
- Infrastructure: Access system-level metrics in one place. This view contains:
- Deployments
- CI visibility (earlier CI insights)
3. Updates to profile
Now, you’ll find all personal settings in your profile. This update makes it easier to view your data and manage your preferences in one place.
Keep your team structure up to date with the new team management API
The team management API helps you automate managing your organization’s team structure and improve data quality by keeping your team structure up to date.
By using the API, you can:
- Get a comprehensive list of your current teams and their configurations:
- Parent team and hierarchy
- Member information
- Jira projects for each team
- Modify the structure of your teams by including, adding, or removing teams and members.
- Keep your team structure in sync.
Here’s how to get started with the team management API:
- Use your existing API token or contact your Swarmia customer success manager or hello@swarmia.com to receive your unique authentication token.
- Once we’ve sent you the API documentation, review it for detailed information and example requests.
- Integrate your internal systems to automate team management tasks.
- Migrate your installation to manage teams with the team management API.
If you have any questions or need help setting up the team management API, feel free to reach out to us via email or through the in-app chat.
Share survey results with your team
Developer experience surveys are only as good as the insights and actions they drive. Our new survey results heatmap makes it simple to get a quick overview. Instantly spot the teams and topics that require your attention, then drill down to individual questions and comments to discover the details.
This view isn't just for the leadership. Many obstacles are best solved by self-organizing teams with the right context and means. Now, you can make the whole report available for your organization with two clicks. Don’t worry — you can screen the comments and prepare your communications before hitting that publish results button.
Additionally, we introduced a detailed participation view so you can easily see the response rates in each team. It’s also available for live surveys to help remind the teams falling behind others.
More updates:
- The code review Slack notification now shows if reviewers have requested changes and if a review is still expected from you despite others’ approvals.
- Your team can now subscribe to review request notifications for any GitHub teams you’re interested in.
Estimate the end date of your initiatives
Staying on top of multiple cross-team engineering initiatives can be challenging. Yet, many internal departments rely on engineering leaders to provide frequent updates on the status and progress of strategically important projects. The problem is that simply looking at an ongoing initiative isn’t going to help you determine when it will be completed.
That’s why we’ve launched a new initiative forecast feature that allows you to estimate the end date of an initiative based on three inputs:
- Total number of issues
- Average issue cycle time
- Average number of issues in progress
You can adjust the values of all three inputs to understand how the estimated end date will change if you add or remove issues, increase the average cycle time of an issue, or start working on more issues simultaneously. The UI will offer suggestions for each input based on your historical data, including previous activity in the initiative and data from the most active team.
Once you’re happy with your forecast, you can save it to the initiative overview page where everyone in your organization can see it. You can always go back and edit the forecast later as you learn more.
To create your first forecast, navigate to the overview page of any ongoing initiative and click create forecast.
More improvements:
- The code review Slack notification now includes the number of comments in the PR.
- The past four full quarters have been added as presets to all time selectors throughout the app.
- Hovering over the PR throughput chart under Insights will now activate a tooltip with the number of contributors per week and the number of PRs per contributor.
View DORA metrics for your entire organization
A few weeks ago, we launched DORA metrics for production environments, enabling more accurate DORA metrics.
Building upon these capabilities, Swarmia now lets you analyze DORA metrics for the entire organization, broken down by teams in the new organization / DORA view.
Trends for DORA metrics
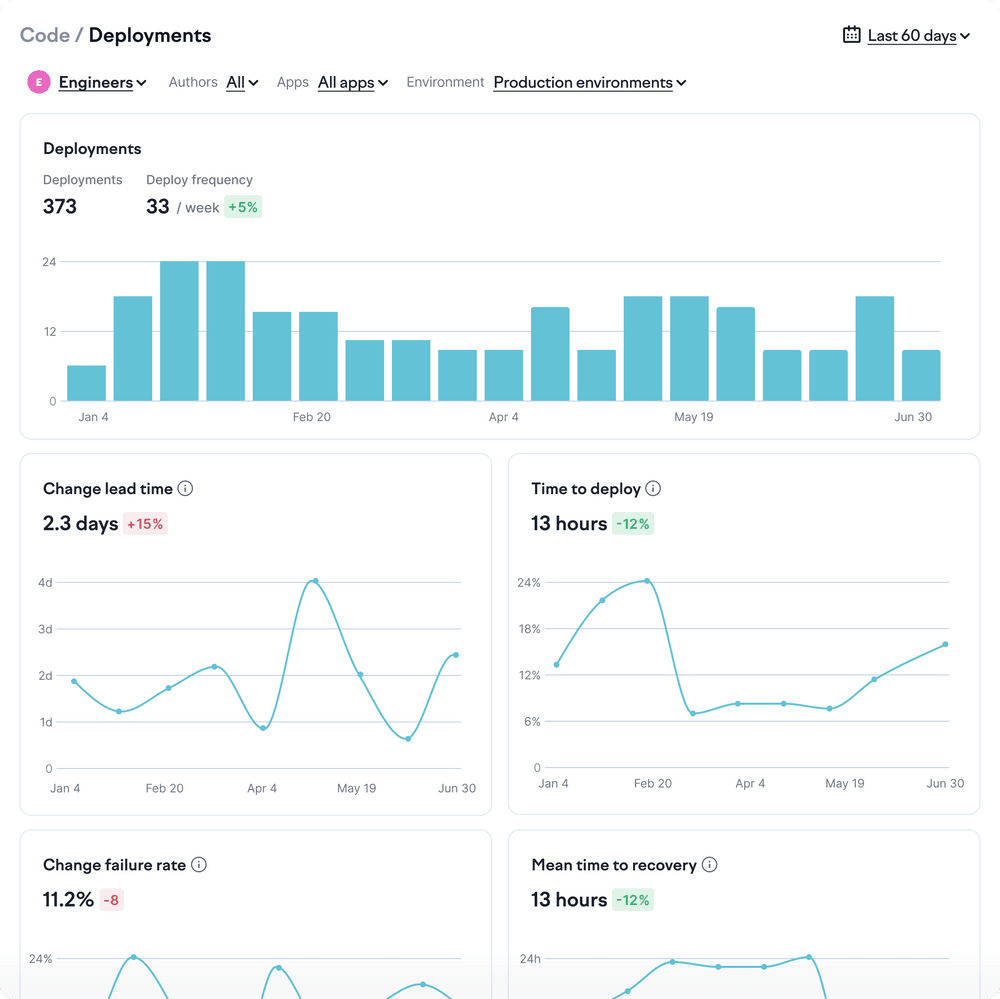
We also improved the deployments view by adding trends for all the DORA metrics. It’s now possible to drill down further from organization insights to see DORA trends and the related deployments for any team. This helps you better pinpoint areas to improve software delivery performance.
Deployments get attributed to teams based on the authors of the deployed pull requests.
DORA metrics for production environments
DORA metrics are the most widely recognized way to measure the speed and quality of software deployments. They're all about pushing changes to production, so deployments to other environments, such as development and staging, should be disregarded when tracking them.
We've made it easier to define production environments in Swarmia, enabling more accurate DORA metrics. You can set global rules or define production environments per deployment app. This flexibility allows you to tailor the metrics to reflect your actual production environments, providing a clearer picture of your performance.
We’ll automatically consider all environments that start with ‘prod’ or have ‘production’ in their names to be production environments. You can change it in settings / deployments.
Anonymous comments in surveys
Survey respondents can now choose whether they'd like to post their comments anonymously. While we recommend respondents to comment using their name to foster more open and actionable discussion, we also recognize that some may not be comfortable doing so. Commenting anonymously lowers the threshold for giving feedback on sensitive issues.
Analyze your investment balance through multiple lenses
Engineering organizations make dozens of decisions every week that all affect teams’ focus and the outcomes of their work. Quantifying this focus allows engineering leaders and teams to base prioritization discussions on data rather than intuition alone.
While we’re huge advocates of the Balance Framework, it only offers one perspective into team focus. However, leaders need to be able to answer a variety of questions, including:
- How do we reduce reactive work?
- How much are we able to focus on our key initiatives?
- How much are we investing in a specific product area?
To make answering these questions easier, we’re introducing additional breakdowns into your engineering investments. Like before, you can create categories based on a broad set of filters to get a more holistic view of engineering teams’ focus. The focus reports roll up across your engineering organization and allow you to drill down to individual projects and issues.
Swarmia admins can create new views by navigating to the investment balance view and clicking the add breakdown button.
Public beta: Complement engineering metrics with developer experience surveys
From the start, our vision at Swarmia has been to offer holistic software development insights to everyone in the engineering organization. By “holistic,” we mean looking at the same issue from multiple angles — in this case, through a combination of sentiment data from software engineers and insights from different dev tools.
That’s why today, we’re excited to announce the public beta of developer experience surveys: a better way for you to collect high-quality developer feedback and combine it with the system metrics and visualizations you already have in Swarmia.
Based on feedback from our alpha customers, we feel confident you’ll gain valuable information and concrete improvement ideas from these surveys. Here’s how Dave Cumberland, CTO of Axios HQ, describes his experience in running surveys with Swarmia:
“The developer experience survey results have been insightful. Swarmia has provided us with a clear understanding of where our teams are excelling and where they could use additional support. The combination of quantitative developer insights with periodic qualitative feedback is powerful. It has allowed us to pinpoint specific areas of improvement and celebrate our successes. Swarmia has become invaluable in enhancing our team’s productivity and satisfaction.” — Dave Cumberland, CTO of Axios HQ
We also published our 32-question developer survey framework, free for anyone to use. Read more about how we developed the framework and copy the survey questions from this blog post.
To run your first survey in Swarmia, navigate to the new Surveys tab and click the create survey button. (Requires admin access.) If you have any questions or feedback, please reach out to us in the chat or send an email your customer success manager or hello@swarmia.com.
Bring your data where you need it with data cloud
Your decisions are only as good as the data that informs them. There are many factors that play into your ability to trust the data. Is the data collected from the right sources? Is it consistent? Does it support how we work? Is it accurately attributed? And finally, is it up to date?
At Swarmia, we’ve considered these factors early on, ensuring that your data setup is transparent, configurable, and explainable:
- You can access the raw data behind each aggregate metric, down to individual commits and issues.
- You control what’s included in each metric, ensuring it reflects your work, regardless of how you use your tools.
- All data in Swarmia is real-time, and any changes you make to the configuration are visible immediately.
With data cloud, you can export high-quality data from Swarmia into your data warehouse of choice, whether you’re using BigQuery, Snowflake, or Redshift. It enables you to run custom reporting queries and combine the data with data from third-party tools.
View the data available for export in our getting started guide. We’re eager to hear feedback about data cloud and your custom reporting use cases. Drop us a line at hello@swarmia.com or reach out to your customer success manager.
See coding activity related to an issue at a glance
When it comes to diagnosing activity patterns and improving the flow of work, looking at issue cycle time is a great place to start. But there are more perspectives to understanding issue activity.
Everywhere you see an issue in Swarmia, you can click on it to see its lifetime and active days. The lifetime includes all activities related to the issue and is usually longer than the cycle time. Active days show how many days there were contributions to the issue. You can also see how the scope changed over time and drill deeper into individual tasks.
This time, we've introduced a new way to look at coding activity related to an issue. Simply click on an issue, scroll down to the bottom, and you’ll see all the pull requests linked to the issue and all of its subtasks. You can view the total number of pull requests, as well as their cycle time, size, and author. You can also navigate to individual pull requests, subtasks, and deployments, all without losing context.
More improvements:
- Swarmia export API now supports full org-level DORA metrics and all code insights columns on the team level. The feature is currently in alpha. Reach out to us at hello@swarmia.com if you’re interested in trying it out.
- In deployment insights, time to recovery and resolving deployment version are now shown in the details popup for the failed deployment. You can also click on the resolving deployment version on the table to open it in the details popup. We also improved attribution of pull requests to deployments when deploying to a new environment for the first time.
- We improved data sync for customers using Jira, making it easier to follow progress when syncing specific projects.
- If you’re looking to upgrade from free to a paid Swarmia plan, you can now pay for your Swarmia subscription with a credit card.
Alpha: Improve developer experience with surveys
Swarmia developer experience surveys are now available to organizations interested in trying them out. Run a survey with any or all of the 32 questions in Swarmia’s survey framework, with questions ranging from team focus to managing technical debt. See how different teams react to different statements, and collect comments for taking action. You can share the results with everyone in the organization, while maintaining confidentiality where necessary.
To get started, reach out to your customer success manager or contact us at hello@swarmia.com.
Preview CI failure logs without leaving Slack
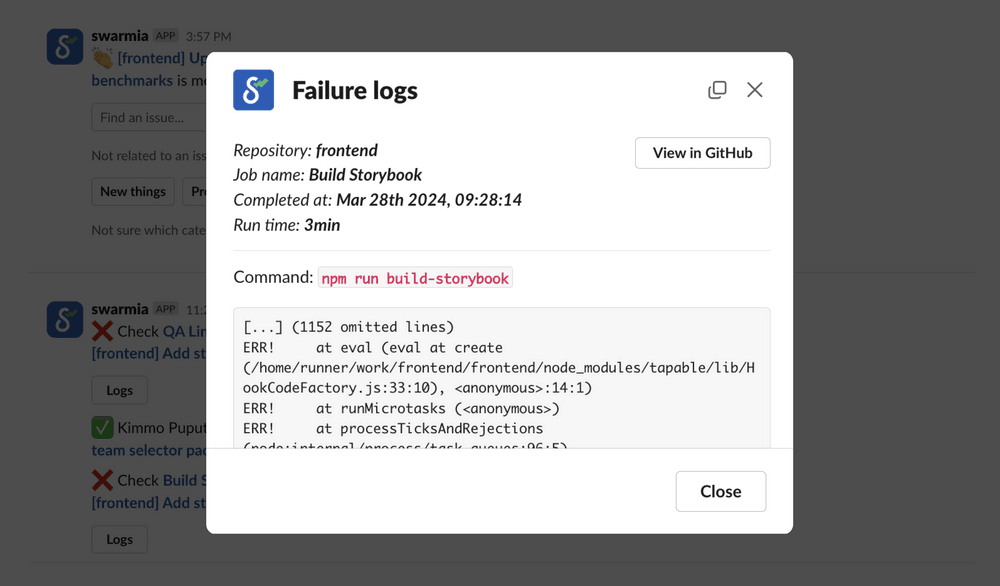
Have you ever found yourself digging through CI logs just to figure out what has failed? Was it a flaky test or something that you actually need to fix in your PR? Now, whenever you receive a notification about a CI check failure for one of your PRs, you'll also get a preview of the last 50 lines of the failure logs directly in Slack.
Not using Swarmia notifications yet? You can enable notifications here.
DORA metrics for teams
You can now view deployments, as well as all four DORA metrics, filtered by engineering team. Navigate to insights > deployments, and select the team you’re interested in from the top bar. A deployment is attributed to a team when at least one of the deployed pull requests was authored by a member of the team. In some cases, the same deployment can be attributed to more than one team, if it contains pull requests authored by members of multiple teams.
More improvements:
- We improved the accuracy of batch size insights by excluding more commonly auto-generated files from the calculations. Now, as you hover over each size bucket, you can also see the percentage of the total number pull requests merged in your team.
- Now, when responding to GitHub comments via the Slack bot, you can use the “>” symbol, and the text that follows will be correctly rendered as a quote.
- We also fixed an issue where a user would sometimes receive a notification twice or have a GitHub comment posted twice when responding to a comment from Slack.
Use Okta SSO to manage user access to Swarmia
If your organization is using Okta Single Sign-On, you can now use it to manage user access to Swarmia. This also means that stakeholders outside the engineering organization can now log in to Swarmia even if they don’t have a GitHub account.
To get started, follow our guide on how to add the Swarmia application to Okta. If you’ve previously been using GitHub for authentication, we’ll automatically migrate everyone in your organization to Okta the next time they log in to the app.
More improvements:
- We keep adding new notifications that save developers’ time and bring essential details about their work directly to Slack. This time, we improved our CI notifications to include more reasons for queue failures, such as merge conflicts and CI timeouts. Not using Swarmia notifications yet? Set them up here.
- Ongoing performance improvements. This year we’re adding more ways to explore your data, from analyzing millions of CI check runs to providing high-level organizational overviews for larger organizations. To support this initiative and elevate the experience for customers of all sizes, we put continuous effort in optimizing the app’s performance.
Smart suggestions for categorizing work
To make sound decisions about engineering investment, you need to have a solid understanding of how your engineers’ time is spent. But the more work remains uncategorized, the more difficult it is to determine how different teams should spend their time.
That’s why today, we’re making uncategorized work more visible in the investment balance view and introducing AI-powered suggestions for categorizing work. Now, when you drill into uncategorized work, the smart suggestions pop up on the right. With the smart suggestions, you can:
- Preview a list of the issues included in each suggestion
- Quickly apply or dismiss the suggestions
Over time, the model will learn how people in your organization categorize issues and pull requests, improving the quality of future suggestions.
More improvements:
- We updated the default investment category rules by adding more labels and title prefixes. We also made the rules smarter, only applying the rules that match existing data.
Real-time pull request activity timeline for diagnosing cycle time issues
Continuous code delivery is a key feature of an effective engineering organization. Several factors influence this: Do we ship in small batches? What's the state of our code review process? How do we handle code reviews that require input from different teams or individuals in other time zones?
In this update, we introduce a new timeline activity view that helps you understand the cycle time of those long-running pull requests. Select a pull request anywhere in the app to see whether review, coding time, or merging delays were the main cause of the increased cycle time. The timeline also includes all comments, commits, and code review events, making it easy to see what happened in each case at a glance. The data you see on the timeline updates in real time, so it always includes the latest activity.
More improvements
- Editing investment categories just got easier. When you make changes to your investment balance configuration, you can preview them before applying. The preview is based on a sample of 1,000 pull requests and issues, showing how they're affected by the change.
- When you choose an issue in Swarmia, you can see the issue assignee, along with other contributors, in the issue activity popup.
Gain visibility and control over strategic work with initiatives
Strategic projects can be particularly challenging to manage. The longer the project’s timeline and the larger its scope, especially with more engineering teams involved, the more complex and less transparent the process becomes. Many existing tools fall short in providing more transparency, as they typically show only a portion of the overall picture. Your issue tracker is limited to only those issues that are actively tracked with it and doesn’t account for untracked work. Gaining access to reliable data required to keep these big projects running can be quite difficult.
Today, we’re thrilled to introduce initiatives, a new feature that helps engineering leaders gain visibility and control over strategic projects. Here’s what you can do with it:
- Gain an accurate view of the project timeline, scope, and progress towards completion.
- Align your plans with the actual activity tracked from across multiple tools, and identify when an initiative is idle or at risk due to longer periods of inactivity.
- Drill down to specific projects to identify problems and facilitate the unblocking of work.
Starting today, you can create and manage initiatives in Swarmia. You can also gain the same level of insight for all projects that contain child issues, including Linear projects, Jira epics and stories, and other issue types.
Over the next few weeks, we’ll also introduce the ability to add your existing initiatives directly from Jira and Linear. In the meantime, you can already do this by reaching out to us directly.
More updates
- In addition to initiatives, now you can see on track, idle, or at risk labels for all ongoing projects (including Jira stories, epics, and Linear projects). An issue is considered idle if there has been no activity for the last 7 days, and at risk if it has been inactive for over 2 weeks.
- You can now filter issues by priority anywhere in Swarmia, and use priority filters to set up investment categories or define issue ownership.
- CI insights now loads faster for all customers.
General availability: Analyze CI trends and cut hours of monthly wait time per developer
Over the past few years, whenever we’ve had conversations with our customers about their CI, they’d describe how it was getting slower, less predictable, and harder to manage as the organization evolved. And when they tried to improve things, it wasn’t clear where to begin — you’d have to analyze millions of check runs across several dozens of repositories to identify patterns that could help improve the CI pipeline.
Today, we’re excited to announce that CI insights are available to all Swarmia customers. You can now analyze your entire CI pipeline, identify long-term patterns and trends, and pinpoint specific areas for improvement to reduce waiting time and increase confidence in your systems. We’ve already seen how small changes can help organizations save hours of waiting time per developer per month.
Currently, the new CI insights are only available for GitHub Actions users. If you’re using a different CI provider but are interested in getting your CI insights to Swarmia, we’d love to hear from you. Please contact us at hello@swarmia.com.
If you’ve been part of the Swarmia Alpha program for CI insights, you’ll also notice a few new features that are now available to everyone. The repository, workflow, and jobs tables all have new trendline and distribution charts, making it even easier to spot anomalies and focus on specific tests that can be improved.
👉 Check out new CI insights in Swarmia
More control over organization settings with the new admin role
This year, we’ve split team and organization-level settings to give teams more control over their work on pull requests, issues, and their preferred notifications in Slack. At the same time, organization settings have become more powerful, which is why we wanted to provide teams with tools to ensure that changes affecting the entire organization are intentional.
With the introduction of the new Admin role, you now have control over who can edit integration settings and investment balance configuration. These settings remain visible to everyone, but only admins can make changes. You can view the list of admins for your organization in settings. Admins have the ability to grant and revoke admin rights from the same page.
More updates
- Now, when you receive a response to a comment on GitHub, the Swarmia Slack notification will include more context about the thread where it was left. This is useful when there are multiple discussion threads in the same PR. You can enable personal notifications in Settings.
- With the latest improvements to data queries, the Investment Balance now loads faster for all users.
Deliver strategic, cross-team projects with confidence
Strategic projects can be particularly challenging since they often span months and involve multiple engineering teams. As these teams push towards their objectives, it’s crucial to ensure that the project scope doesn’t grow uncontrollably over time. Teams should be able to collaborate efficiently and make progress without being sidetracked by other priorities.
Our latest update brings you a new way to examine your projects and ensure they’re on track. Here are some of the things you can do with this new feature:
- Track contributions and collaboration patterns of teams and individuals over the project’s lifetime.
- Visualize planned work with start and target dates presented on a timeline.
- Navigate the expandable timeline view, which displays lifetime activity on child issues, including coding activity and the activity from your issue tracker.
👉 The new view is now available for projects with child issues, including Linear projects, Jira stories, and epics. To use this feature, select an issue to view it in the side panel, and click the Open as page button located below the issue title.
More improvements
We made it easier for teams to preview and modify settings relevant to their team. In this update, we've added new team-specific issue settings and Slack notification preferences, giving teams even more control over how they use Swarmia.
Alpha: analyze and reduce CI build times with Swarmia
If you’ve worked as a developer, you know that waiting for CI builds can be a real pain. In fact, unreliable CI/CD setups can result in hours of waiting time per developer per week. This only gets worse as the organization scales, translating into six-figure losses and weeks of idle time in larger organizations every year.
Today, we’re excited to announce our new alpha feature that helps engineering organizations measure how much time they spend waiting on CI builds and analyze how the situation has changed over time. The new CI insights also help you identify which services and workflows contribute to those waiting times, so you can pinpoint issues and address the root causes.
👉 Join the Swarmia alpha program. As of today, the new CI insights are available to select Swarmia customers using GitHub Actions. To participate, reach out to your customer success manager or contact us directly at hello@swarmia.com.
More updates
- We’ve added support for canceled issues for both Jira and Linear customers. Now, when you set the issue status as canceled (won’t do, won’t fix, or similar) in your issue tracker, it will be displayed as such in Swarmia. By default, work on canceled issues will still be visible in Swarmia. In issue insights, you can exclude them by applying a filter for issues with a status is not canceled from the filter bar.
- When you connect Jira to Swarmia, we now automatically map issue statuses, cutting the setup time in half for larger organizations. We also applied the new, automated mapping to all our existing customers.
- It’s now easier to look back at merged and closed pull requests. In the pull requests view, work is now grouped by date, pull requests are sorted by merge time, and the total cycle time is displayed on the right.
Compare data to previous period in organizational insights
We continue to enhance our organizational insights, and this time, we’ve included comparisons with the previous time period for all organizational metrics in Swarmia. Seeing two time periods side by side adds more context to the data you see and helps you identify anomalies, such as spikes in code review time or rapid increases in the amount of work in progress.
See your biggest investments across the entire organization
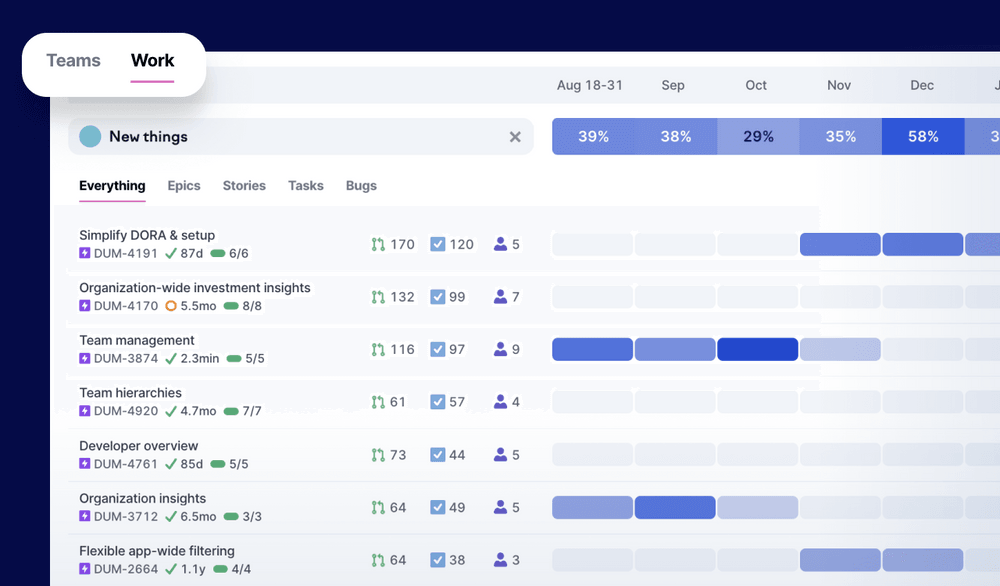
With our latest updates to Investment Balance, teams gained a new way to analyze where they are allocating their time and effortlessly identify the most significant or long-lasting investments.
Now, the same features are accessible for all organizations with fewer than 50 contributors. If your organization falls under that range, got to investment balance and proceed to the work tab to see work breakdowns by category for the entire organization.
For larger organizations, the work tab becomes available when a team with fewer than 50 contributors is selected.
Better CSV exports for investment balance data
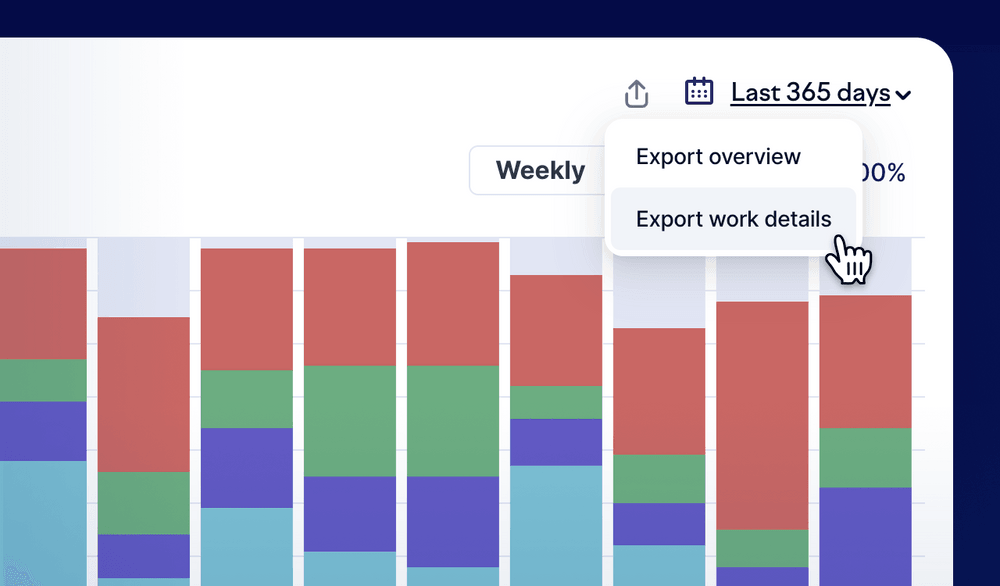
This year, we’ve been improving our exporting capabilities to make it easier to integrate Swarmia data into your internal systems.
Previously, we only supported exporting the high-level investment overview, but with the latest update, you can also export a more detailed report that contains all work across all categories in the selected timeframe. To get the detailed report, navigate to the Work tab of investment balance and click the export button in the top right corner.
Review unlinked pull requests in investment balance
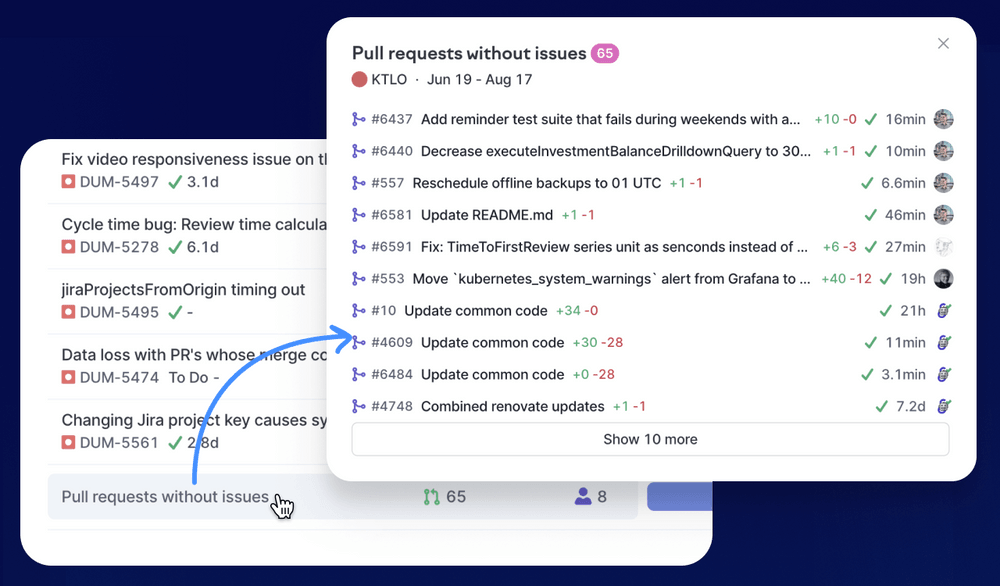
Linking pull requests to issues ensures that you get most relevant insights across all the tools you use. While Swarmia offers a variety of ways to streamline and automate linking, it’s totally normal for some work to occasionally slip through the cracks and remain unlinked. Now, within investment balance’s work tab, with an investment category selected, you can click on the pull requests without issues row to review all unlinked pull requests in each category.
More updates
- Large pull requests are now shown as larger bubbles in work log, helping you spot those big PRs. 🎉
- You can now filter issues and pull requests by investment category in insights.
- You can now subscribe to a personal notification when a team you’re part of gets assigned a pull request review.
- We’re working on a new early-access feature that helps you apply a cost estimate to your investment balance data. If you’re interested in participating in testing this feature when it becomes available, please contact us at hello@swarmia.com.
Understand your biggest engineering investments and follow trends across teams
When we introduced the new investment balance just over a month ago, we gave a glimpse into the exciting features we had planned for later this year. Our new major update delves even deeper into helping engineering leaders understand investment patterns in engineering teams and the entire organization.
A whole new way to look at work. The work view in investment balance got a complete redesign. When you select a category, it’s now pinned on the chart, making it easy to see how it trends over time. You can also slice and dice your data in a variety of ways:
- Sort your projects to look at the most recent, longest-running, or biggest investments (considering the total number of contributions)
- Start by examining all work or narrow it down with specific issue types to gain a focused view into Epics or Bugs.
- Zoom in to look at one month of work at a time (or one week with the weekly grouping)
Follow a category across all teams. When looking at teams, you can now pin a category to highlight it and sort by it in the teams table. This way you can see what teams have maintained momentum shipping new features or struggled with keeping the lights on. We also added a delta to the previous time period to the table so it’s easy to see how the investment balance has evolved over time.
Try out the new investment balance
More improvements
- Filters across the app got even more powerful. Now you can filter issues by title and apply negations (e.g. “label is not bug”) anywhere in the app. The new filters make it even easier to capture work to investment categories and define work that belongs to each team.
- The app home page got a new modular design highlighting relevant Swarmia features based on the user role, tailored to developers, managers, and engineering leaders.
- We completed an internal security audit in June-July 2023. Swarmia conducts security audits twice a year, and security is on the checklist for every new feature we build.
- In team settings, you can now see what teams don’t have issue ownership set up. Assigning issues to teams helps Swarmia map issues to the right teams in your organization, and is required for using features like work log and issue insights.
Meet the updated investment balance
Running a software team is a balancing act. You’ll want to ensure that as you build new things, you also address your technical debt and invest in productivity improvements. See also our blog post sharing best practices for balancing engineering investment.
This summer, we’re releasing a whole bunch of updates to Swarmia’s Investment Balance. And today, we’re excited to unveil the first batch.
Now you can drill down to investment balance at any level of the organization, from a high-level overview to the work of individual teams. This update goes hand in hand with the support for team hierarchies we introduced last month. (You can set them up in Settings if you haven’t done it yet.)
In the following weeks we’ll introduce more exciting updates, including better drill-downs into a single category of work across teams, and tools for analyzing trends. We’re eager to hear your feedback on the update.
Reach out to us with the in-app chat or via email at hello@swarmia.com to let us know what you think.
More improvements
- Fixed an issue where the timeframe would reset when navigating in organizational insights.
- Improved the performance of issue insights, where some views would previously time out on longer timeframes.
- Lately, larger teams might have experienced slowness in the Work Log. We applied an immediate fix and continue looking into improvements that keep it snappy for all customers.
Support for team hierarchies and a new home for organizational insights
Every organization is unique, and Swarmia is designed to adapt to and reflect your organizational structure, routines, and ways of working. With our latest update, we're taking things to the next level, enabling engineering leaders and managers to get a clear view into the organizational hierarchy.
Now, you can create and manage nested teams and use all Swarmia features at any level of the organization. Managing nested teams in Swarmia is flexible, easy to set up, and easy to adjust as your company evolves.
Let’s take a closer look into what’s new:
Nested teams work just as you’d expect: they align with your organizational structure, and you can use most Swarmia features with teams on any level, including Work Log, Investment Distribution, and other features. You can also create Working Agreements and set up team notifications, including the daily Slack digest, for nested teams.
Nested teams are easy to configure. For teams with subteams, the work shown everywhere across Swarmia is defined as a combination of their subteams’ work. No additional configuration is required.
You can add direct team members to teams at any level, and team memberships can be managed in Swarmia and synced from GitHub automatically.
If you already have teams set up in Swarmia, it's easy to upgrade to nested teams. Navigate to Team Settings, create a new team, and add your existing teams as subteams. Work configuration will be inherited from subteams automatically.
Following this update, organization-level insights also got a new home in the app. In the following months, we'll keep adding more capabilities to the organizational insights, including improvements to DORA metrics, issue activity insights, and the investment balance.
Categorize issues in one click
Sometimes it’s easier to categorize work right where you see it. In addition to using flexible auto-categorization rules, it’s now possible to categorize issues manually — or override the investment category assigned by Swarmia automation.
To review uncategorized issues, navigate to Insights > Investment Distribution and expand the Uncategorized lane, where you can preview and categorize individual issues on the list.
Make engineering work visible with Developer Overview
Visualizing engineering work with views like Work Log and Investment Distribution has helped hundreds of modern software teams significantly improve their focus and flow. Our new Developer Overview aims to do the same thing — but this time with an emphasis on the work of individual engineers.
Developer Overview makes it easy to see what each developer has worked on and helps facilitate discussions about their work. It allows developers and their managers to:
- Make work visible. Identify who the developer has worked with recently, compare the ratio of own pull requests to reviewed pull requests, and navigate to past work items to analyze them in more detail.
- Visualize activity patterns. Quickly see all the projects the developer has contributed to and spot systemic issues like too much work in progress or working alone on bigger issues.
- Analyze focus. Assess whether the developer has been able to focus on the right things and maximize their learning and impact.
The benefits of Developer Overview
Developer Overview is not a tool for stack ranking individuals or reducing them into a single number. In fact, the view is first and foremost a tool for developers to learn and grow in their career. With it, developers can:
- Take initiative on their own learning and development
- Easily reference what they worked on, and figure out who to ask for feedback
- Analyze completed work and have better discussions with their peers and manager
- Back up career development discussions with data
How to get started
Access the Developer Overview by clicking on your own or any other contributor’s avatar anywhere in Swarmia. You can read more about the benefits and use cases of Developer Overview in our blog and the Help Center.
As always, if you have any feedback or improvement ideas, we’re all ears. Simply get in touch with your CSM or fill out this quick feedback form.
Support for GitHub Deployments as a data source for deployment insights
As we hinted in the previous changelog, we’ve been working on one final piece of the deployment insights puzzle: supporting GitHub Deployments as a data source.
If you’re using GitHub Deployments to track deployments across your repositories, you can now select it as a deployment source in Swarmia. This makes it even easier for you to surface DORA metrics and keep tabs on applications with multiple environments.
If you’re already using GitHub Deployments, we recommend this method over GitHub checks, as it will give you more accurate data and it’s easy to set up.
More improvements
- We introduced an option to export a team’s Investment Distribution in CSV format. This allows you to combine the team’s data with e.g., cost data to produce financial reports.
- Insights views now show longer default timeframes that you can use to analyze progress over the last 6 or 12 months.
Simpler deployment insights and out-of-the-box DORA metrics
We’ve made multiple improvements to deployment insights within the past few months. Here’s a summary of the changes.
We’ve made analyzing deployments easier by bringing them into a single view. You can see all four DORA metrics in one place and drill down to individual applications and deployments.
We’ve also simplified the configuration and added support for multiple data sources. Getting started with deployment insights only requires a few clicks, and you can easily switch between different data sources.
Manually tracking change failures takes effort, which is why Swarmia can now automatically detect change failures from version rollbacks and pull request reverts. You can also automate additional change failure scenarios through the Deployments API.
More improvements
- We’ve enabled automatic change-failure detection by default for applications using GitHub Check or PR merge data sources.
- You can now include commit information in the Deployments API payload.
What’s next for deployment insights?
- We’ll add support for GitHub Deployments in the coming weeks. This will make tracking applications with multiple environments even easier.
- We’d love your feedback — if there’s something we could improve, drop us a line at hello@swarmia.com.
Code review nudges to help you stay on track with your working agreements
Feedback loops are an essential part of Swarmia. Our working agreements allow teams to agree on how they want to work together and stay on track as they’re building new habits. Teams can subscribe to the Slack daily digest to get updated on all the exceptions to their working agreements.
Now if your team has a working agreement around pull request review time (e.g. "review pull requests in under 24 hours"), we'll send a friendly reminder to the pull request reviewer when a review is nearing the target. We’ll send additional notifications two days after your target, and then finally four days after it — after which we’ll go quiet. The new notification is enabled automatically for all teams with the review time working agreement.
This new notification is part of a series of improvements to the Swarmia Slack app we've planned for this year. Have feedback to share? Drop us a line at hello@swarmia.com.
Not using Swarmia personal notifications yet? Here's why you should. You can enable them in settings.
DORA change failures: auto-detection of rollbacks and pull request reverts
Measuring change failures can be tricky. There are many different reasons changes can fail, and often the data on these failures and what caused them doesn’t exist in any systems. We also wrote an article on how we suggest approaching measuring Change Failures.
We already support multiple ways to report change failure data to Swarmia. You can report Change Failures via our Deployments API or mark failing deploys and deploys that fix them manually in Swarmia.
Now Swarmia detects some common change failures automatically:
Rollback detection checks if the exact same version has been previously deployed to the same environment (e.g., production). If Swarmia detects a rollback, a change failure is recorded for the latest deployment before the rollback.
To detect reverts, Swarmia checks if any of the pull requests included in your deployment were reverting a previously deployed pull request (based on commit messages, branch name, or pull request description).
More improvements
- We completed internal and external security audits in January 2023. Swarmia conducts internal audits twice a year, and external audits once a year. Security is on the checklist for all the new features we build.
- You can now export data from your organization’s Code Overview in CSV format. This might be helpful if you’re looking to share Swarmia insights with stakeholders outside Engineering or use the data in third-party tools.
- We’ve added new pull request filters to Batch Size insights, including filters by status, repository, and author.
🚀 Major updates to deployment insights (and DORA metrics) in Swarmia
This December has been all about bringing DORA metrics to the next level, ensuring teams can get an accurate view of their deployment process, and follow change failures and time to recovery no matter how they deploy.
With the latest update, all deployments are now tracked in one place. We added improved support for multiple deployment data sources, which you can configure for each service or application you deploy. Let’s go through them one by one:
PR merges
This option is the easiest to configure, and it works best when you deploy continuously. When you first sign up for Swarmia, we’ll automatically use this method to prefill deployment insights for some of your repositories.
GitHub checks
If you run a GitHub check every time you deploy, Swarmia can use it to track deployments. This approach supports checks from both GitHub Actions as well as third-party tools like Jenkins or Circle CI.
Swarmia Deployment API
This is the most powerful way to track deployments in Swarmia. The Deployment API allows you to pass change failure information directly to the platform. You can also use our UI to manually mark change failures.
What’s next? We’re looking into automating change failure detection in the coming weeks, and we’ll keep an eye out for other deployment methods to support. Reach out to us at hello@swarmia.com if you have any specific wishes or ideas around this.
🔎 New powerful pull request filters are available in code insights
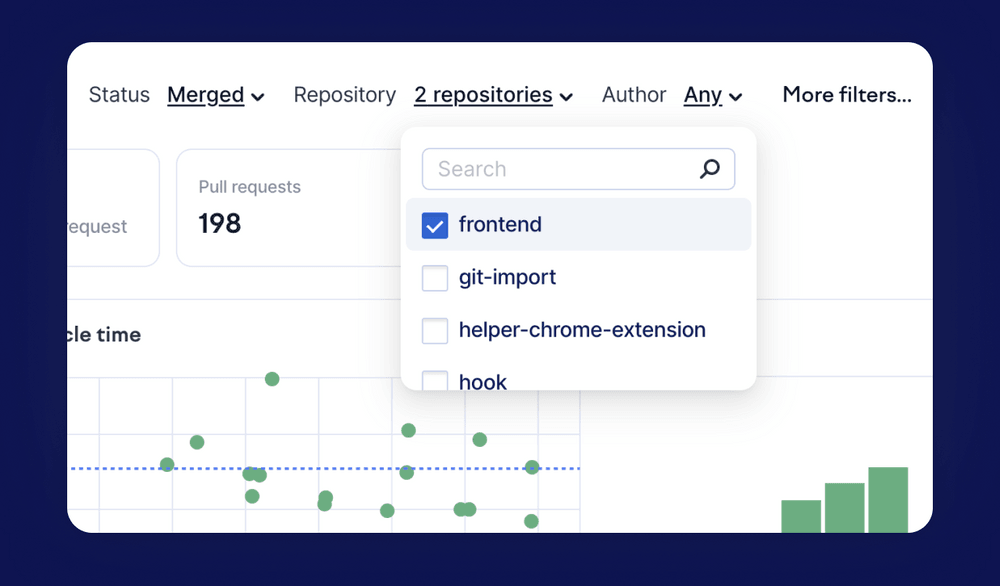
This year we introduced flexible filters across the app that power a significant part of the Swarmia platform and features like team code ownership, Investment Distribution, and issue ownership.
In our latest update, we bring the power of filters to cycle time insights, making it easier than ever to look at data from different perspectives.
👀 Emoji reactions for GitHub comments available to all Slack app users
We take pride in building the best engineering productivity platform that puts developer experience at its core. Thousands of developers use our Slack app every day to save time on routine tasks and focus on things that matter.
Now it’s possible to react to GitHub comments directly in Slack, adding color to your everyday conversations 👍 👀 🎉
🎉 2022 Reviewed: Swarmia year-in-review ping delivered to all our Slack users
We wanted to do something special this year to celebrate all the fantastic work software teams got done this year. If you had our Slack notifications enabled by yesterday, you should have received a friendly year-in-review ping from our Slack bot.
Did you miss out on your year-in-review ping? Make sure to enable notifications and reach out to us at hello@swarmia.com to get your personal 🎁 delivered!
More improvements
- Swarmia now identifies when a pull request has enough reviews to be merged. This is helpful if you require more than one approval for a pull request to go live. The changes are also reflected in the review rate chart. A PR is considered reviewed only once it has all the required approvals.
- Our review request notifications on Slack just got better. You’ll now see whether a PR is awaiting review or is approved and ready to merge (it’ll get a gentle strike-through at this point).
More control over work that belongs to your team
Every team is different, and we built Swarmia to ensure teams have complete visibility into all team-related matters.
By default, when developers write commits and create pull requests, we attribute all their work to the teams they are part of. This ensures no work falls through the cracks, and you get a clear picture of what everyone is working on.
With our latest update, teams have more control over work attributed to them in Swarmia. You may want to adjust team ownership when a team member works across multiple teams, or some PRs include exploration work that you don't like to be considered in PR-related metrics and alerts.
Keeping the app snappy
Building a snappy, data-heavy product at scale requires constant investment in app performance as we onboard more customers.
In the past few weeks, we’ve focused on making our most powerful views faster and improved performance monitoring to catch issues sooner. We already see significant improvements on average, and will continue investing in keeping the app fast for our users as we grow.
Experienced performance issues lately despite the updates? Let us know at hello@swarmia.com
More improvements
- 99.9% uptime and a new status page. You can access information about uptime and incidents affecting Swarmia users at status.swarmia.com
- If you use Linear as your issue tracker, you'll notice that we now sync Linear projects in real time as part of a larger effort around data consistency
Better ways to manage teams in Swarmia and GitHub
One of our product principles acknowledges that every team is different. We haven't seen two software teams working the same way, even within the same organization. So we built Swarmia to adapt to the routines and processes of each team — no matter how they use Jira, plan work or collaborate — to create a smooth user experience.
Managing teams in Swarmia just got easier. Previously, if you used GitHub teams, these teams were created in Swarmia automatically. Now, you're in control: you can choose to base team membership on GitHub teams, add team members one by one, or do a combination of both.
Here’s how it works:
- Create a new team in Swarmia
- Add GitHub users individually or add entire GitHub teams to the team
- The GitHub teams you use will automatically stay in sync — so if team members change in GitHub, the changes will automatically be reflected in your Swarmia teams.
- You can add multiple GitHub teams and users to each team in Swarmia.
We’re eager to hear your feedback about this change. Drop us a line at hello@swarmia.com.
More improvements
- Configuring investment categories is now easier. You can review all uncategorized work in Settings to create better auto-categorization filters.
- Faster team onboarding. When you connect Jira to Swarmia, we now suggest to auto-assign Jira projects to teams for an even smoother onboarding experience.
- Better Jira custom field support. We added support for two new Jira fields: Advanced Roadmap teams, and Components. You can already use these filters in team ownership and investment category settings.
- Ongoing performance improvements. As we onboard more customers, some teams might have experienced slowness in the app. We continue working on performance improvements across the app, especially for larger organizations.
Organization-level code insights are now available to everyone
At Swarmia, we're building a product that enables organizations to have healthy conversations about their work and where they want to improve. In order to drive change, it is crucial to consider all levels of the organization — from one team to the company as a whole — and have a shared language for having team discussions, backed by data you can trust.
With engineering teams being Swarmia's core focus, we're proud of the data quality we've achieved for teams so far. In recent weeks, we've been doing the groundwork required to bring those insights to the next level (quite literally), enabling reliable, trustworthy insights across multiple teams and the whole engineering organization.
In the new organization-level code insights, you can see key metrics across multiple teams, including cycle time, review rate, review time, throughput — and more.
In the coming weeks, we plan to expand our support of the cross-team and organization-level features. As we do it, we take great care in surfacing data that enables a healthy culture of continuous improvement for everyone, from engineering leaders to individual developers.
More updates
- Using Jira custom fields to assign issues to teams? Now you can use custom fields to define investment category filters and Jira settings in Swarmia.
- When you send deployment data to Swarmia via the API, you can now provide an optional Description, which will be shown in the UI alongside other data
- Finding the right Jira projects to connect to Swarmia is now easier. You can search for projects based on their name or Jira key in Settings.
Create and manage teams in Swarmia
At Swarmia, we ensure your insights accurately reflect your processes and organizational structure. With our advanced contributor management, it's already possible to bring team member accounts across tools like Slack, Jira, and GitHub into a single profile so that all contributions are attributed to the right people and teams.
We also automatically identify and merge duplicate accounts, and if a team member happens to commit code using a new email address, we'll suggest linking it to an existing account.
With our latest update, in addition to importing teams from GitHub, you can also create and manage teams in Swarmia. Now you have more flexibility in managing team data without making changes to your GitHub organization.
Navigate to team settings to create and manage teams.
More updates
- Deployment insights: now you can customize your deployment insights by selecting a deploy branch for each repository.
- Change failure insights: we received reports of incorrect data being queried for some accounts, which we've fixed. Now the data is also grouped by day, helping to spot daily patterns (e.g., whether most failures occur on Friday).
Flexible issue filters
We continue to introduce flexible data filters across the app. In addition to investment category filters, team ownership, and PR exclusions, you can now use filters in issue insights to filter data by label, status, issue key, and issue type. Now it's easy to slice the data in various ways and dive deeper into different categories of work.
The filters are saved in the URL, so you can bookmark or share what you see in Swarmia with others.
More updates
- If you want to limit unsanctioned code pushes to the default branch (master, main), check out our updated working agreement. It now alerts you on code pushes in the last 24 hours, while listing all commits pushed directly to the default branch over a two-week window.
- In Work Log, we made the dots for large commits bigger to help you spot major code contributions easier.
- Pull requests that you've excluded from metrics and alerts are now also excluded from Work Log and Investment Insights.
Simple, consistent timeframes
This week comes with a complete overhaul of our timeframe selection UI. Now the selected timeframe is preserved across all insights views as you navigate the app, and timeframe presets are more readily available.
More updates
- We completed an internal security audit in July. Swarmia conducts internal or external security audits twice a year, and security is on the checklist of every feature we build.
- We launched on Product Hunt, ranking as #3 Product of the Day and #4 Product of the Week.
- We added placeholder images for team avatars that we're unable to sync from GitHub, primarily for the GitHub Enterprise accounts.
Cycle time breakdown for individual pull requests
Investigating cycle time issues just got easier with the new cycle time breakdown for individual pull requests. Just click on a pull request anywhere in the app to see the time it was in progress, waiting for a review, or awaiting merge. It helps to investigate and act on those outlier pull requests you can spot in insights and alerts on your team's working agreements.
Change failure rate & MTTR: link failed deploys with reverts and hot fixes
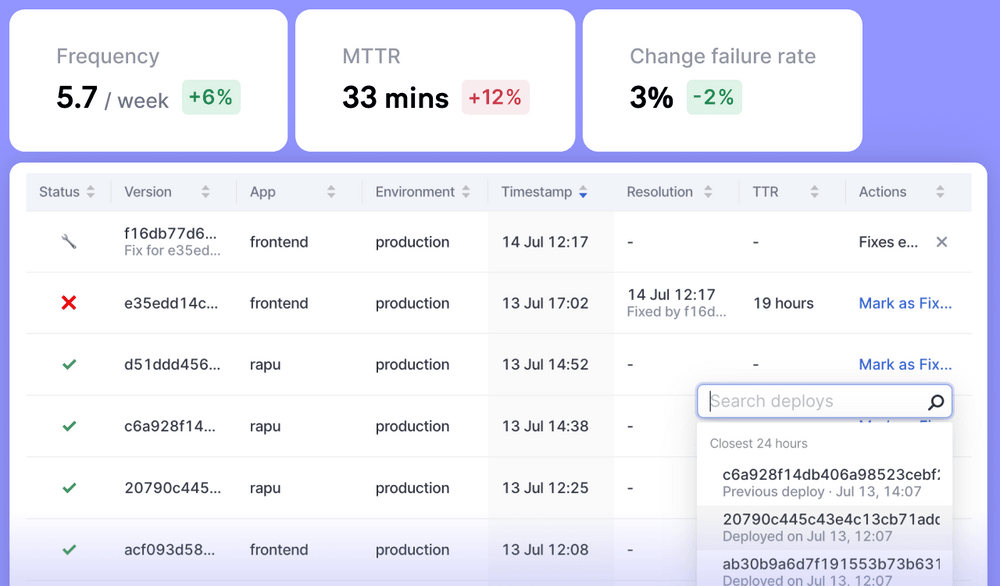
Measuring DORA change failure rate and mean time to recovery (MTTR) has many aspects. We recently published a post about measuring it the right way.
Sometimes a deployment goes through without failing but still results in an issue that requires a fix from the dev team. Now it's possible to tell Swarmia what deploys represent those fixes and link them directly to the deploys that caused the issue.
Doing this allows calculating time to recovery and change failure rate more accurately even for those deploys that technically don't fail but still end up breaking something.
Not measuring change failure rate & MTTR in Swarmia yet? Reach out to us at hello@swarmia.com to get started.
Follow working agreements targets from anywhere in insights
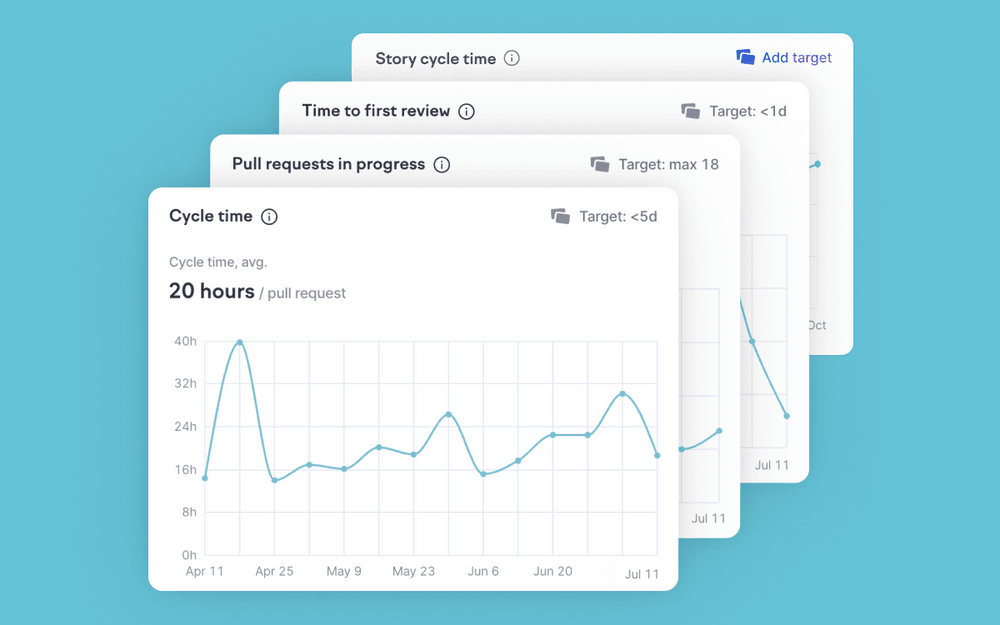
We brought working agreement targets closer to more places in insights, making it easier to adopt new agreements and review the exceptions right as you explore trends and patterns in your Swarmia data. You can find the targets across all Flow insights, as well as pull requests cycle time and review time insights.
More improvements
Most data in Swarmia stays in sync with other applications in real time. Merge a PR in GitHub and — boom — it's merged in Swarmia too. In some rare cases though, it's not possible to get the latest PR status on the fly. Now, if you notice pull request data that is out of sync, you can refresh it manually in Swarmia.
Linear integration is out of beta
Swarmia was the first analytics app to integrate with Linear in September 2020. Since then, we've expanded on the features available to our Linear users, adding support for investment insights, flow insights, and Working Agreements.
Today, our Linear integration is officially out of beta, immediately available to connect in the Swarmia app. Now it's also possible to customize your Linear team mapping right in Swarmia to make sure the correct data is shown for all teams.
Use investment insights based entirely on GitHub data — issue tracker integration is no longer required
We've seen tremendous interest in investment insights this year, and we're constantly coming up with new ways to get 100% of your work auto-categorized within minutes.
We've added 14 new issue and pull request filters since we first introduced the feature — and with the extensive coverage of git-based filters, it's now possible to use investment insights entirely based on GitHub data. Having an issue tracker connected is no longer a requirement for using investment insights, and the feature is available to all customers.
Looking for a recap on the topic? Read our ultimate guide for balancing engineering investment .
More improvements
- We added an explicit setting for posting team review reminders in Slack. Review reminders are sent to the team channel when the team is assigned a review.
- We improved the way we sync personal GitHub data for our users. Now, if you change your name or avatar on GitHub, all you have to do is log in again for the change to take effect.
- Initial repository sync is now more robust, improving the onboarding experience for larger organizations.
Respond to GitHub comments in Slack
Swarmia's Slack bot helps you get code reviewed faster, saves you time waiting on failing CI builds, and automates other routine tasks that bots do better.
With our latest update, you can respond to GitHub comments without leaving Slack. The bot's rich line-by-line comment previews make sure you have sufficient context to respond. This is especially useful on mobile or when addressing small comments.
If you've been waiting for a sign to{' '} start using Swarmia notifications, this is it.
Other updates
- We improved the previews of the comment bubbles in Work Log. Now, we also show comments posted inside threads, which we didn't before.
- Getting Linear and Jira insights in Swarmia is now easier as we show better onboarding instructions to teams that haven't configured them yet.
- We fixed an issue that caused some Slack notifications to be sent twice.
- We added a confirmation prompt when editing issue type mapping affects multiple teams in your organization.
More ways to auto-categorize pull requests
Swarmia's investment insights help engineering organizations balance focus across roadmap work, technical debt, fixing bugs, and other investment areas. You can set up flexible filters to auto-categorize work according to your organization's needs.
With the latest update, we introduce more ways to auto-categorize pull requests, adding filters by label, repository, branch name, title, and status to investment category configuration, increasing the accuracy of investment insights.
Auto-exclude pull requests from metrics and alerts
Continuing with the theme of improving insight relevance, you can now auto-exclude specific pull requests from metrics, as well as the daily digest, for the whole organization.
You may want to auto-exclude revert or release pull requests, or draft pull requests used for research projects. You can exclude contributions by pull requests status, branch name prefix, title prefix, or repository. You can also exclude pull requests manually from anywhere in the app.
Auto-exclude pull requests in Settings. Learn more in the Help center .
Combine data from multiple GitHub organizations in Swarmia
If you happen to work across multiple GitHub organizations, now you have more options for managing your data in Swarmia. With our latest update, you can choose to combine data from multiple organizations or use Swarmia for each organization separately.
Learn more in the Help center.
Complete DORA metrics: calculate MTTR and change failure rate based on your deployment data
When it comes to understanding software delivery performance, the framework introduced by the DORA team in the 2018 book Accelerate is the best-known one among engineering leaders.
Earlier this year, we published our guide to DORA metrics to help you understand how to get the most value from them.
Swarmia already had extensive coverage of the software delivery insights around change lead time and deployment frequency. Now we've improved our deployments insights, adding MTTR (mean time to recovery) and change failure rate for complete coverage of DORA metrics.
In order to calculate these metrics with Swarmia, all you have to do is inform Swarmia about deployments of your app and fixes to previous deployments (fix data is used to calculate time to recovery). You can then filter deployment insights by app and environment in Swarmia.
Performance improvements: improved page loads for data-heavy views and faster Slack notifications
As we onboard more organizations to Swarmia, we want to make sure the app feels fast even as you load historical data for hundreds of contributors.
Our latest performance improvements significantly improve page load times, bringing almost 50x improvements on some queries.
Interacting with Swarmia's Slack notifications should now feel snappier as well.
More improvements
- When you select a team anywhere in Swarmia, we now preserve your selection as you navigate in the app.
- We improved the logic behind the “Avoid working alone” working agreement, making sure only the issues that belong to your team are included in the exceptions.
- It's now easier to assign Jira issues to teams. When you filter issues by Team ID, we now show the team name behind the ID in the dropdown.
Focus on the work that matters: improved team ownership mapping for Jira issues
We improved how Jira issues are mapped into issue types in Swarmia and how issues are assigned to teams. The process is now simpler and more intuitive, with separate configurations for the issue types and team ownership mapping. It's also more flexible, supporting more filtering options for the team ownership. This allows you to adapt Swarmia to just about any Jira setup — we've seen a few, and no two are exactly the same.
- Less repetition — define issue types on the organization-level, instead of doing it separately for each team (e.g., “count as Stories any issues that are a Story or Improvement”).
- Quick team-level configuration — choose which issues your team is interested in (e.g., “issues in project X or any issue with label Y belong to team Z”).
- Smarter defaults — if your organization has newly signed up to Swarmia and you haven't customized your issue types on Jira, you don't have to do any issue type setup.
Check out our new guide to get more out of Work Log
Work Log is a powerful tool for visualizing the various activities of your team, but it can take a while to learn its full potential. We've collected some healthy and unhealthy patterns and made them available while you're browsing your data. You'll be able to open the new guide from the info button at the top right corner of Work Log.
Polished user experience for GitHub Enterprise Server
We've recently made investments to bring the GitHub Enterprise Server experience to full parity with cloud-based GitHub setups. Contact us to learn more about our enterprise offering.
Other improvements
- The Pull Requests view now displays separate sections for merged and closed pull requests, making it easier to analyze abandoned work and find pull requests that you've merged but forgot to link to an issue.
- We recently updated the default time span of Work Log to two weeks. You can now navigate this new view one week at a time, allowing you to investigate any two-week period.
- The “Link pull requests to issues” Working Agreement now only tracks merged PRs, so that work that's still in progress isn't flagged as an exception.
- We improved the logic for sending Issue summaries to avoid sending Slack updates about uninteresting status changes.
- Login failures caused by GitHub errors now clearly tell the user what happened.
More accurate investment insights
We improved the logic behind investment categories to help teams make better investment decisions with Swarmia. Categories are now mutually exclusive and collectively exhaustive, meaning that they don't overlap, and each issue can be linked to only one category. When you configure automated filters to map work to categories, it's now possible to specify the category order. If an issue matches multiple categories, we'll assign it to the highest match on the list. It makes investment insights more accurate and gives you more control over your data in Swarmia.
Filter pull requests by investment category
Another essential aspect of investment insights is transparency. Now you can filter pull requests by investment category and see cycle time, review time, and throughput for each category. It's easy to see pull requests categorized as Technical Debt or Firefighting and improve the way you deal with those issues in your team.
Merge and delete categories while preserving linked data
Once you start tracking investments in your team, it's not uncommon to merge or split categories to get a more accurate picture of the work. Now it's easy to move work between categories when you make changes. When you delete a category with contributions linked to it, we'll ask you to move contributions to a new place. No data lost!
2-week Work Log
We bumped the default timeframe of Work Log from one to two weeks to help you spot work patterns over a longer timeframe. We also improved Work Log data loading, and navigating between views is snappier.
Other improvements
- Contributor settings now allow showing all contributors at once, and bots are shown aside from other active contributors.
- Previously, we looked only at coding contributions to tell who contributed to projects in your issue tracker. Now issue assignees are included as well.
- We improved the login experience for our GitHub Enterprise customers.
- Issue activity popup is now wider and fits more data.
- We added a GitHub link to pull requests in working agreement exceptions to help you get more context in one click.
Batch size insights
It's no secret that small pull requests are easier to review and merge than large ones. But often times, it is hard to put a finger on when exactly large PRs start to become a problem. With our new batch size insights, you can see how pull requests are distributed by size and spot patterns in the review process and pull request flow.
Support for multiple GitHub organizations
We want to make sure Swarmia adapts to various organizational structures, team setups, Jira configurations, and best practices followed in the teams — because every team is different. Now you can log in to multiple different GitHub organizations with Swarmia, making insights more relevant for companies with more complex organizational structures.
Better UI for linking and categorizing pull requests now available for Jira and Linear users
When drawing insights from data across different tools, getting data quality right is crucial. In Swarmia, there are multiple ways to ensure every contribution — commit, task, PR approval, or comment — is accurately attributed to initiatives and team members.
Some work can be automatically categorized with our investment categories and pull request filters. Alternatively, you can manually link contributions, giving you flexibility and control over your data in Swarmia.
With the improved Slack linking notification, it's easier than ever to link pull requests to issues or categories in one click. We improved the search experience and accuracy of linking suggestions. The notification is now available both for our Linear and Jira users.
Start using the new notification by adopting the working agreement to link pull requests to issues (or categories) in your team.
Share links to any issue or pull request in Swarmia
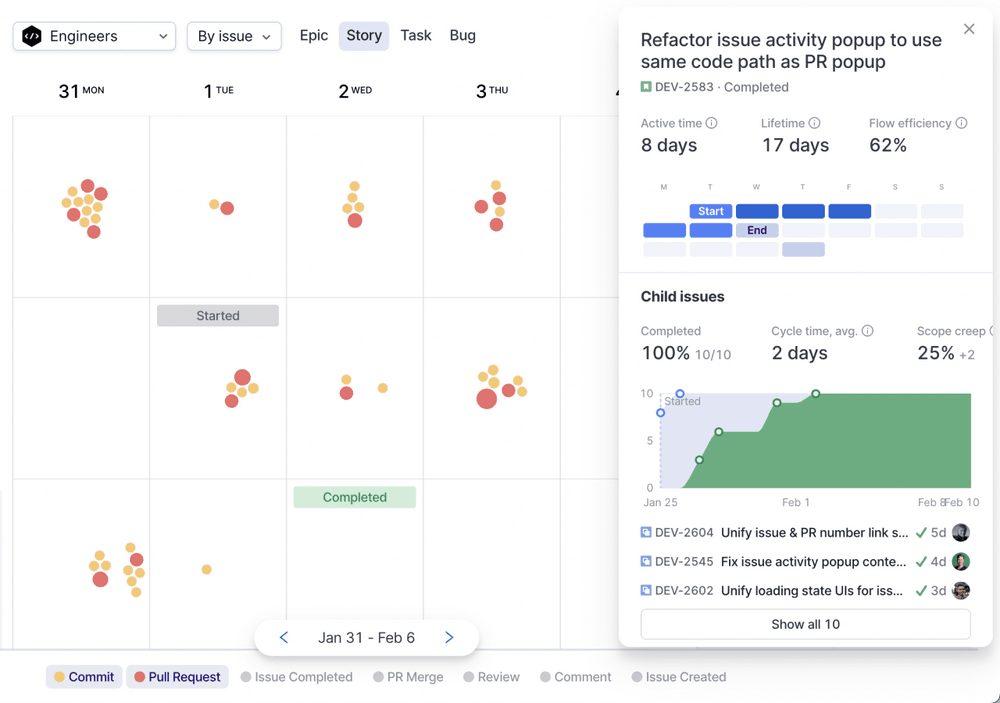
Each popup with issue or pull request insights now has its location saved in the URL, making it easy to share a direct link with others and discuss with the team whenever you notice an outlier or a pattern worth looking into.
Bi-annual security audit and performance improvements
We conducted our bi-annual security audit in December 2021-January 2022, followed by a security strengthening project. We're committed to our customers' data security, and security is on the checklist of every feature we build.
Another update improves the Swarmia experience for larger organizations. With the latest improvements to how we handle data, contributor settings for organizations with hundreds of contributors now load much faster than before.
Get more context on individual pull requests in Insights and Work Log
We’ve made it easier to dig deeper into individual pull requests anywhere in Swarmia. Now you can select any PR in Insights, and Work Log to get more context, link an issue or investment category, or exclude outlier data from metrics and alerts.
- See commenters, reviewers, and the author of any PR at a glance
- Exclude outlier pull requests in one click
- Link pull requests to issues or investment categories
- In review insights, click on any dot to see all reviews of the highlighted PR at once
- The selected pull request is saved in the URL so that you can share it with others
Work Log by investment category
Swarmia's investment categories are perfect for understanding where your team's time goes. Automated filters allow mapping all work to custom categories so you can get accurate reports on how the engineering teams' time is spent between roadmap items, firefighting, chores, and other types of work.
Work Log by investment category takes it to a whole new level. It shows all work by investment category — up to individual commits — in a calendar view. Use it to get insight into how daily decisions affect the investment distribution.
When do ad-hoc projects interrupt our focus? Do teams tend to focus on bug fixing at the end of the sprint? What technical debt issues got resolved this week? These are just some of the questions you can now answer.
New code insights and metrics
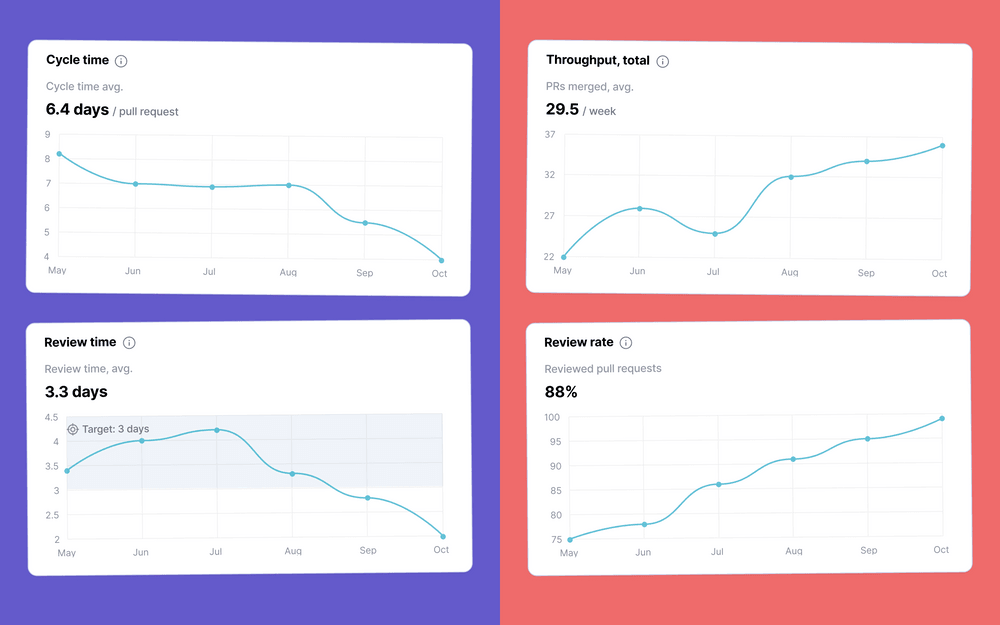
We've added a new code overview section to Insights, where it's easy to follow how your key metrics evolve week over week. Cycle time and Review insights got dedicated pages to help drill down to the data behind the aggregates.
There's also a new Review rate chart in Insights. It shows how many pull requests got approved before merging. Making sure all code gets reviewed improves code quality. You'll want to take action if the review rate falls under 70-80% of all work.
No more noise from bots
Teams love Swarmia's Slack notifications because they help them stay focused. However, review request notifications from bots had been contributing to unnecessary noise in team channels.
We won't send notifications about bots' review requests from now on. You can still see their review requests in Swarmia. Manage bots under Settings → Contributors.
Actionable alerts on Working Agreements
Our automated working agreements have taken huge leaps forward this year, with more teams getting aligned on how they write and review code, maintain code quality, plan work, and improve focus on work that matters.
The latest update brings working agreement insights to more places in the app, and improves our Slack digest to make it easier to focus on that one pressing issue the team agreed to improve on. With all the ongoing alerts to working agreements highlighted, it’s easy to take action before a negative trend starts to form.
GitHub Enterprise is now supported
We’ve added GitHub Enterprise to the list of our supported tools. Earlier this fall, we also added support for Jira Server, increasing our coverage of on-premise integrations.
Swarmia is now more than ever equipped to serve larger engineering organizations, driving continuous improvement in software teams at scale. Contact us to learn more about our enterprise offering.
Performance improvements
In November, we onboarded more new organizations to Swarmia than ever before. As a result of the increased application loads, some users may have experienced slowness in the app. With the latest performance improvements to data queries, the app is now faster for all users.
Custom investment categories
Software development is all about focusing on the right things, but even for the best teams it’s not uncommon to see up to 70% of all work not reflected on the roadmap: it can be bugs, customer requests, technical debt, or chores that end up taking their time.
With the new investment insights you can track these (and any custom) categories in Swarmia, and get an accurate, highly customizable view into how teams spend time.
Seeing this data was an eye-opening experiences for many of our customers, sparking great discussions, and resulting in even more focus on work that matters.
Encourage team collaboration with the new working agreement
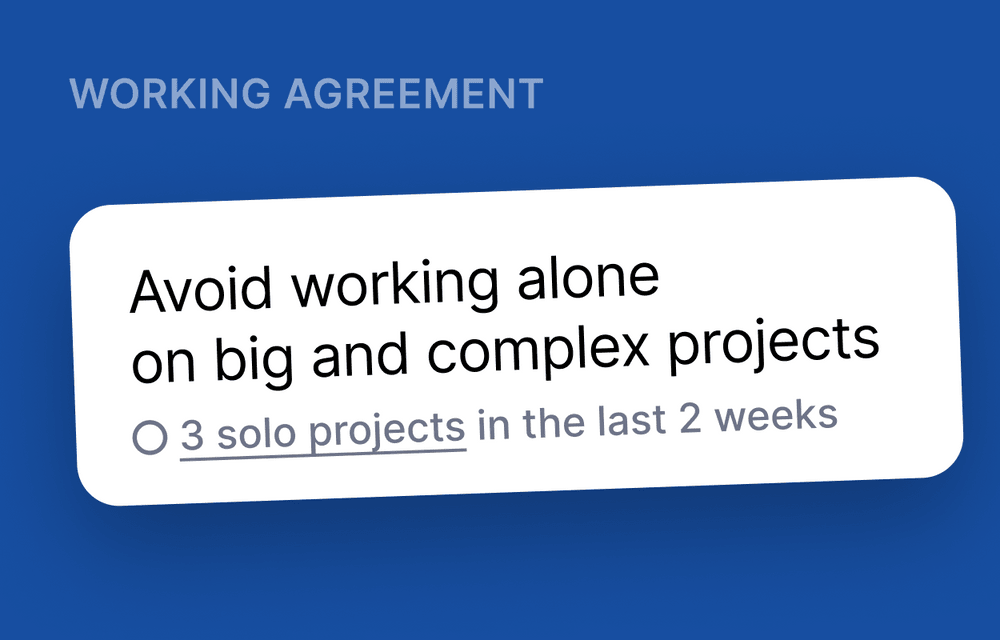
Working alone on a large project can feel demotivating and slow. In the long term, it leads to situations where only one person is familiar with a project or codebase. And if they get blocked while working alone, or go on a vacation, it’s challenging for somebody else to join in and help.
Now there’s a working agreement to help you identify and review projects with solo contributors.
Other improvements
- We've added initial support for GitHub Issues as an issue tracker.
- Now you can see both who’s been assigned to an issue and who has completed it in Work Log.
- If you're using Linear, you'll see all contributions to Bugs grouped to a dedicated row in Work Log.
- Swarmia is now SOC 2 Type 1 certified. We've completed our SOC 2 Type 1 certification in our ongoing commitment to keeping your data secure. Security has been in Swarmia’s DNA from the very beginning. We conduct security audits and training every six months, and security practices are on the checklist for every new feature we build.
Issue completions in Work Log
When we share these updates with you, we look back at what we’ve shipped in the past weeks that’s worth celebrating. It turns out there’s no better tool for that than Work Log. It is a snapshot of how teams spend time week over week, making it easy to tell the theme of the week at any time in the past.
You can now see issue completions as dots in the Work Log. This allows you to see work without code commits and gives you a better sense of how projects are moving forward.
Focusing on data quality in Work Log enables us to build insights you can trust. This data powers our Investment Insights that we’re working on improving now, and we can’t wait to share more soon.
Exclude individual pull requests from all metrics
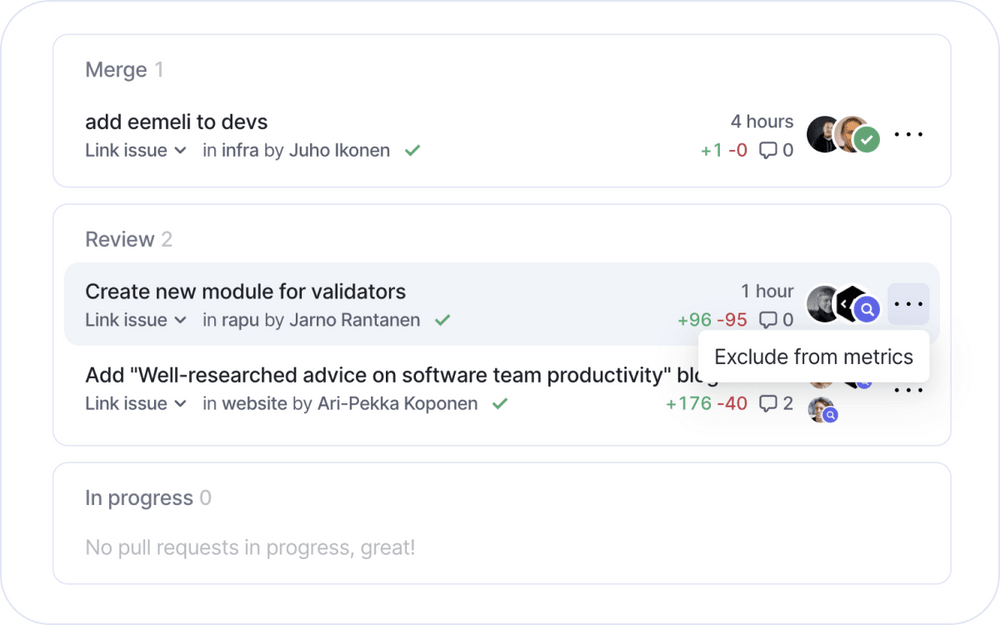
Metrics can be a black box, so we show the individual data points behind all numbers you see in Swarmia. Outliers can have a significant effect on those numbers. Now you can exclude individual pull requests from all metrics to make your Swarmia insights even more accurate.
On-premise Jira support
We haven’t seen two teams who wor in the same way, and build Swarmia to adapt to your team’s tools and ways of working. If your organization uses Jira on-premise, we now support that too.
Issue summaries
Celebrate when you get a larger project completed with a new team notification. Get a summary of the key metrics like scope creep, active days, longest-running tasks, and more — right in Slack. We continue to invest in automated tools for categorizing work. Now you can link pull requests to investment categories automatically by adding a rule to auto-assign work to categories based on PR titles.
Customize your daily digest
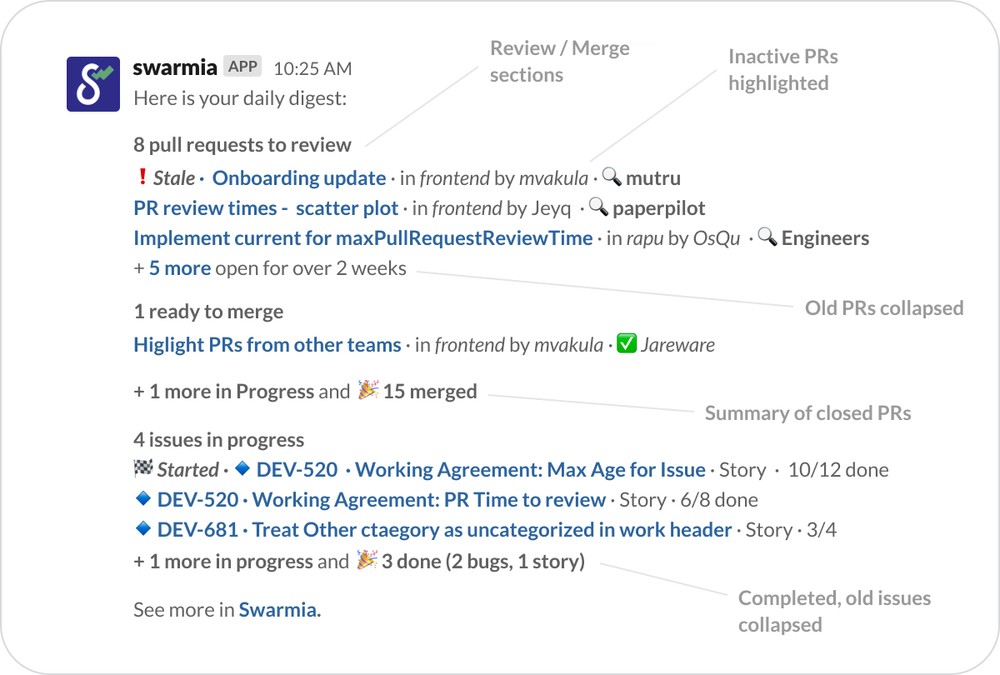
In Swarmia, when teams agree on an improvement area, they adopt a working agreement. It’s the starting point to measure where the team is at right now and to set a goal for the future.
But setting a goal is no guarantee that change will follow. Things tend to get lost and forgotten, and what’s brought up in retrospectives is not always taken forward.
80% of teams using Swarmia get our daily digest that provides a feedback loop for their continuous improvement goals. It contains a daily status update on all working agreements and a summary of actions required from the team. Now you can choose what data to include in the digest.
Investment distribution overview
The best teams know where their time is spent and balance efficiently between the most impactful work and housekeeping. It ensures they can reach the high-impact business objectives and solve the right problems in the short term, without compromising the capability to do so over the long term.
Here are some common anti-patterns to observe when it comes to allocating time:
- The majority of your time is spent on bug fixing and maintenance work
- Technical debt is increasing over time, and is not being addressed
- An increasing amount of time is spent working on ad-hoc projects
- Less than 50% of the time is spent on roadmap work
Swarmia’s new investment distribution view gives transparency to the different areas of work teams focus on to help you achieve a balance in how the time is spent.
Use it to see your time allocation by area, and drill down into individual projects to investigate further.
Swarmia completed its latest security audit
Security is an integral part of Swarmia, and since the inception of the product, we’ve been conducting regular security reviews twice a year. In July 2021, we completed our latest security audit and training based on OWASP ASVS 4.0 controls.
Introducing deployment insights
Our goal is to bring transparency and insight into the entire product development process and empower software teams to own their ways of working. When we introduce high-level metrics like cycle time of pull requests and issues, our primary focus is on data quality (see more in our help center). We break high-level metrics into contributing factors allowing teams to investigate their development workflow in greater detail — ultimately, it's all about making insights clear and actionable.
Swarmia’s holistic approach has gotten even more complete with the addition of deployment insights. Now you can see deployment frequency, average deploy time, and deploy success rate in Swarmia.
We use GitHub’s check runs to analyze deployment data. Enable deployment insights by selecting relevant check runs in repository settings in Swarmia.
Performance improvements
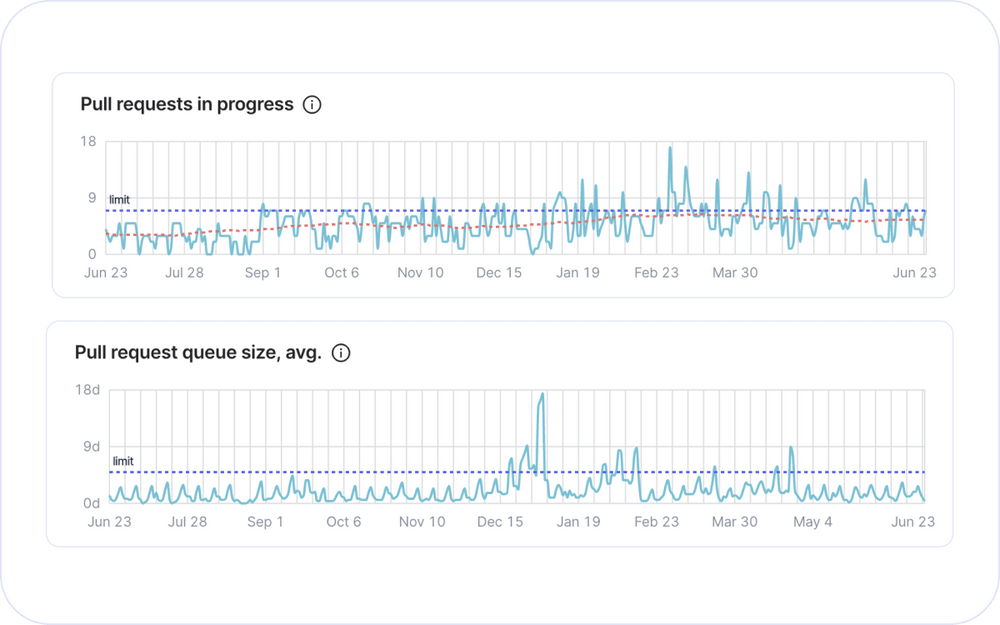
We’ve improved the performance of all charts and tables. Now it’s easy to load up to a year’s worth of data on a team's performance — helping to spot trends and outliers that aren’t as clear on shorter timeframes.
More clarity for issue cycle time calculation
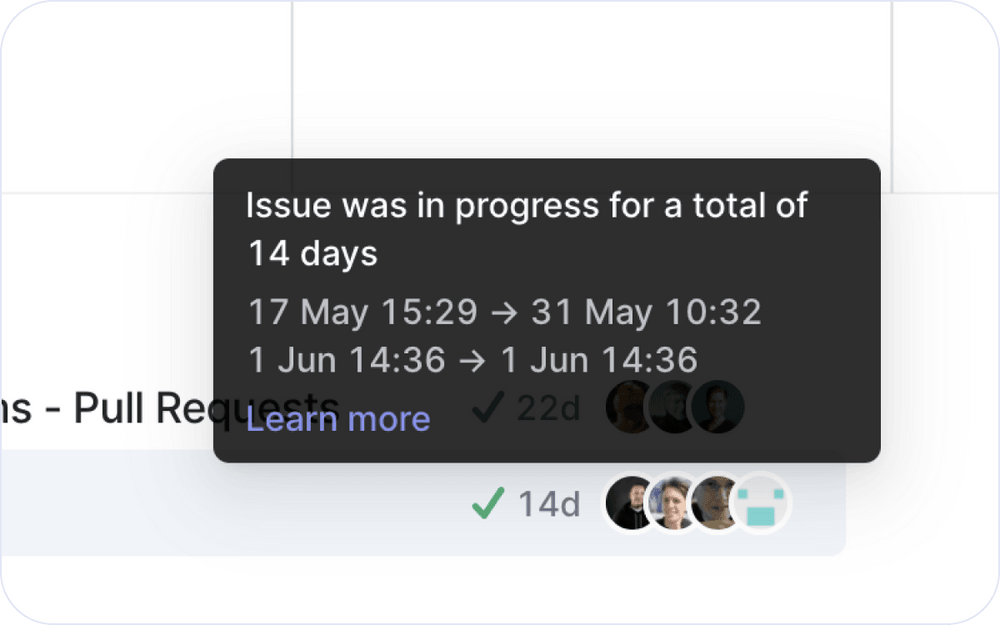
You can now see the exact time intervals included in cycle time calculations for all issues: just hover over the time an issue was in progress anywhere in the app.
If an issue was in progress more than once (it happens if it was moved to in progress by accident, or returned to backlog half-done), only relevant time intervals are counted towards the cycle time.
New cross-team insights
Measuring and limiting work in progress is at the core of continuous improvement. When a team works on too many things at once, things move slower, affecting the team's ability to deliver value. Introducing work in progress limits helps increase flow, boost focus, and create the slack necessary to plan new work and improve ways of working.
Work in progress can be measured on a few different levels. At Swarmia we visualize what's in progress both for code - pull requests - as well as for issues in progress. Swarmia's Insights show the relationship between work in progress and cycle time, helping teams to arrive at an optimal WIP target and set up a working agreement to spot early signals of WIP increasing.
With the latest update, it's possible to select multiple teams in pull request insights to see how individual teams' WIP and cycle time trends compare to the rest of the organization. In addition, it aims to show if the observed trends are team-specific or reflect the general direction of the organization as a whole.
To access cross-team insights, select more than one team in the dropdown on top. As of now, it's available for PR insights only, but we’re planning to bring the same functionality to issues next.
Other improvements
- We've improved the definition of issue cycle time to account for issues with complex status histories. Previously, if an issue was moved between In Progress and To Do or Done statuses more than once (e.g., if the issue was moved to In Progress, then put on hold for a month, and returned back), cycle time would be the total time from the first time it was moved to In Progress until the last time it was moved to Done. Now cycle time includes only the time the issue has spent in the In Progress status, according to your issue tracker.
- 🎉 Swarmia’s deployment insights are now in alpha! Contact us to get early access.
New issue insights: table view, rolling average trendline
Lately, we’ve been busy improving our pull request insights to help teams explore and understand the raw data behind cycle time, review time, and other metrics. Now we’re bringing the same improvements to issue insights.
Use them to get an overview of cycle times, scope size, and scope creep for all ongoing and completed issues. We've found that even in best-performing teams scope creep is not uncommon, and some variation in scope is totally normal. Yet it's important to look into what makes scope grow (tasks added while you're already working on a feature) to improve the quality of the planning. We've also added a rolling average trendline to all charts to help you follow work in progress and cycle time trends over time.
Next, we’re working on new high-level insights that show trends across all teams in an organization. Let us know if you’re interested in getting early access to try them out.
Other improvements
- We believe data quality is a feature and constantly improve the logic that helps assign contributions to the right people across tools. Now you can see all active contributors in Settings to make sure their work is assigned correctly.
- Fixed a bug where issues moved between Done and In Progress more than once would be shown incorrectly in Swarmia.
Spot and prevent scope creep early on
Remember that time when a small and straightforward project ended up taking weeks or even months to complete? We've all have been there. Today we're excited to introduce new tools to help you diagnose flow issues, recognize scope creep signals early on, and improve planning accuracy.
👉 Select an issue in Work Log to see a burn up chart with all tasks added and completed over its lifetime. New tasks added while an issue is in progress count towards estimated scope creep.
Other improvements
- When tracking commits merged to master without review, you can now see the name of the default branch for each commit in the exceptions list, and each repository in repository settings
- Bugs issue type is now available for all working agreements (e.g. Bugs are closed in under 7 days)
- Performance and stability improvements: we fixed some timeouts and "Unexpected token < in JSON" errors that you might have seen lately
Granular control over Slack notifications
Swarmia’s notifications are designed to help you focus, save time, and enable powerful workflows — like linking pull requests to issues — right in Slack. We care about keeping the noise level to a minimum: if you get a notification from Swarmia, it means an action is required from you.
With the latest update, you have even more granular control over notifications you get from Swarmia. Now you can choose what comments and PR-related updates you want to be notified about.
Other improvements
- You can now edit GitHub, Jira, Linear, Slack data associated with your Swarmia account
- Improved accuracy when calculating cycle time in Pull Request Insights
- All charts under Flow Insights now include rolling average lines
- Improved error handling and stability of the app
New insights into your pull request workflow
Getting high-quality data about your pull request pipeline is the first step to a better understanding of process changes that improve velocity and quality. Our new pull request insights are here to help. See some key highlights below.
Cycle time average graph (on the right) shows how long it generally takes you to close pull requests, and how the situation develops over time. If you close pull requests timely, it trends down. Pull requests left open for several days result in an upwards trend. Aiming to close all pull requests in under a week (or 1–2 days on average) is a good starting point for uninterrupted delivery.
Pull requests in progress graph (on the left) gives a clue into how your ability to close pull requests is affected by the number of pull requests worked on at once by the team. Working on too many pull requests at once can result in longer delivery times, and we recommend adding a work in progress limit (e.g. up to 7 pull requests open at once) to make sure pull requests piling up don't slow down the team.
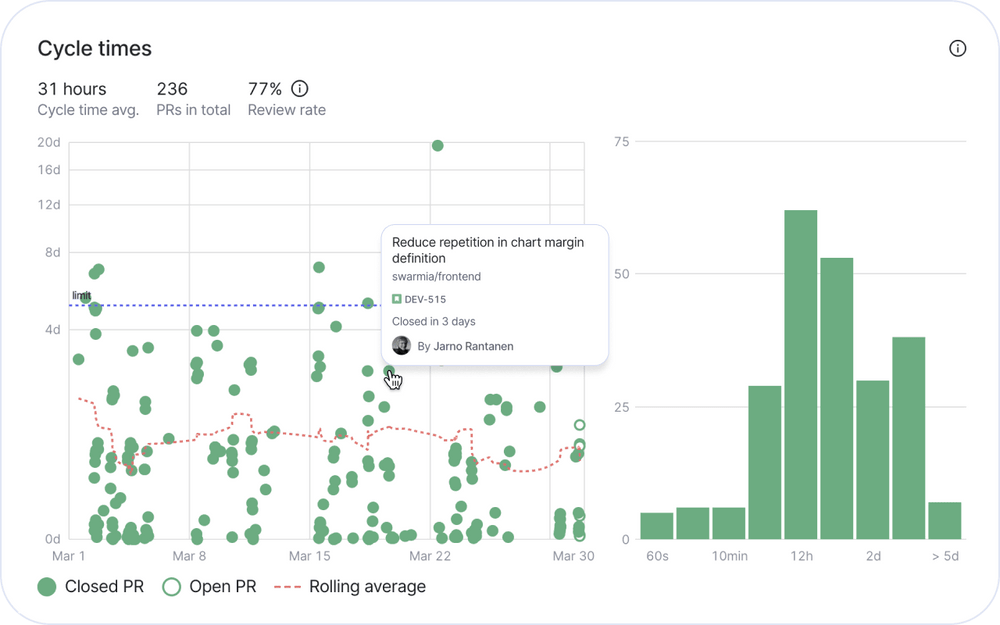
➡️ Cycle time distribution chart (on the right) shows what portion of pull requests takes longer than expected to complete, and individual pull requests are shown in the scatter plot on the left. Pull requests far above the rolling average line need special attention — it’s the code that’s been waiting for the longest to be delivered.
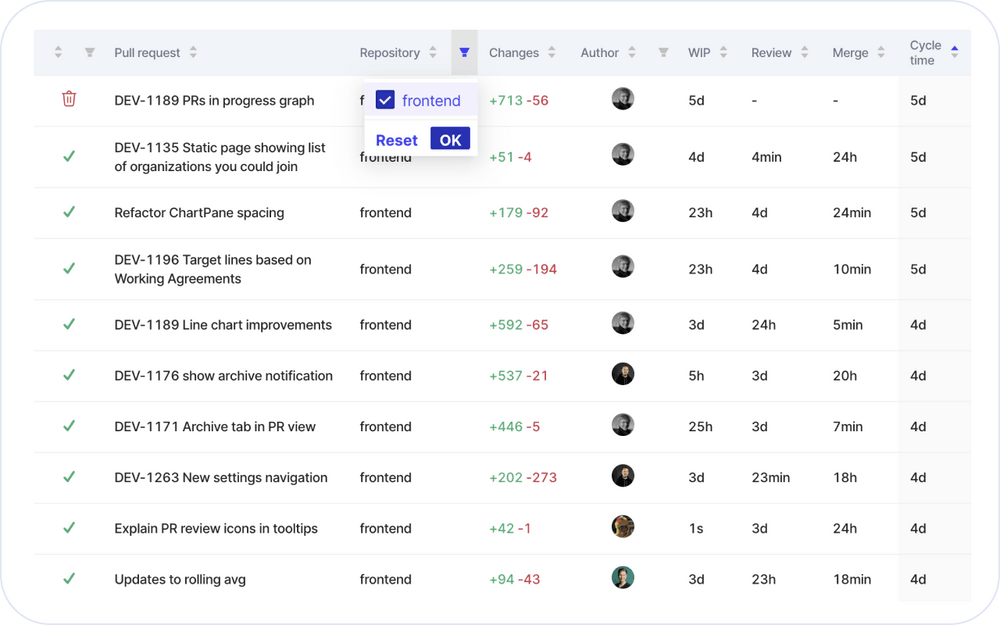
Filter the pull request table by status, repository, or author (by clicking the filter icon in the table header) to identify problematic pull requests. Filters apply to the table as well as the charts above.
Review time is another important contributing factor to cycle time. Sorting the table by review time helps to identify pull requests that have spent the longest in review — or have been merged without review at all. The number of pull requests merged without review is reflected in the review rate above the charts.
Other improvements
Tasks completed with no coding activity are now shown at the bottom of Work Log making it easier to see where the engineering team’s focus has been week to week.
Pull request archive for old and stale pull requests
Old open pull requests can make pull request cycle time metrics difficult to interpret. Our new pull request archive gives you the option to hide old and stale pull requests in Swarmia. This is especially useful for you to start focusing on improving ways of working when adopting Swarmia without letting the burden of the past get in your way.
If your team has pull requests with no activity since the last 30 days Swarmia prompts you the option to archive them on the Pull Request view.
Archived pull requests are excluded from all metrics in Swarmia and Slack daily digest. After archiving, you can still browse them on the Pull Request view.
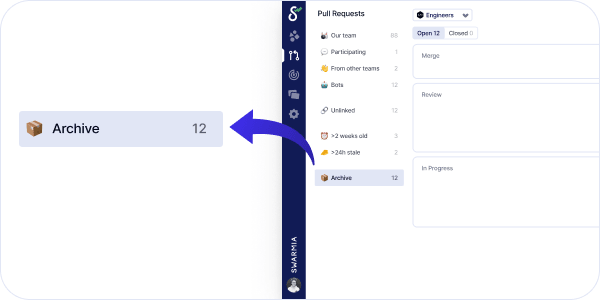
Self-signup available
Your colleagues can now sign up to Swarmia directly from our website. Based on the new user's GitHub account details, we can identify and link the user to your organization in Swarmia. In addition to providing a self-signup option, you'll still have the option to share an invite link (available on the app front page) with your colleagues.
Track unreviewed code pushed straight to the main branch
Code review helps ensure code quality, and share knowledge within the team. Yet even among teams performing code reviews regularly, pushing unreviewed code to master is not uncommon. Our new working agreement helps track all commits merged to your main branch without review, and start a conversation within the team if it becomes an issue.
See how your team is doing under Explore → We don’t push code directly to main branch. Connect Swarmia’s Slack digest to get a daily summary of all unreviewed code pushed to production.
Select what teams to see in Swarmia
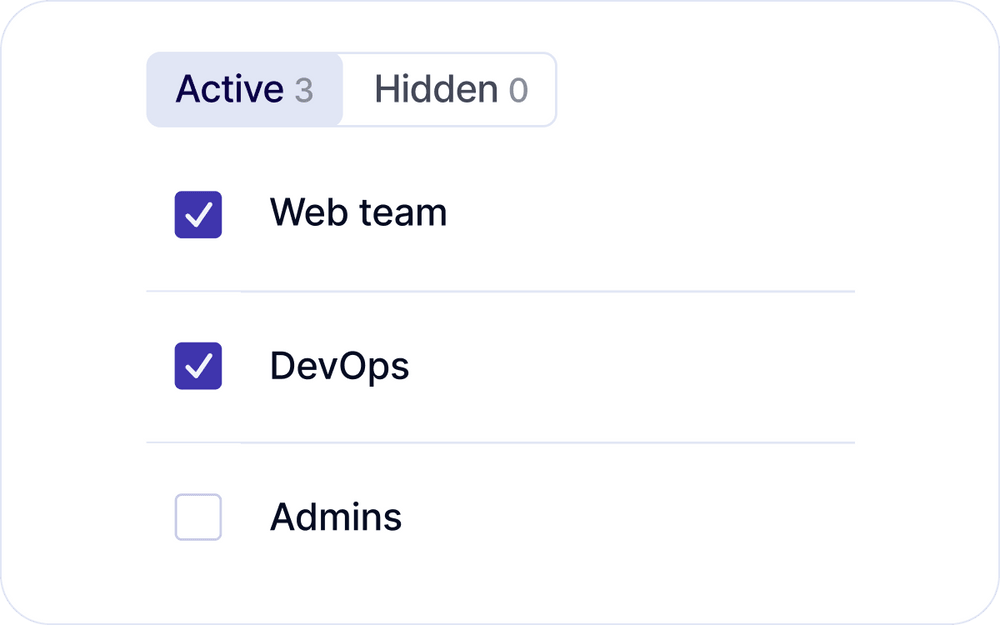
Now you can choose GitHub teams to show in Swarmia, and hide teams that do not represent actual development teams in your organisation: for example, if you use teams for access control. We’ve hidden some of these teams automatically based on Swarmia usage. 👉 See them all here.
Other improvements
- Pull request dots in all scatter plots now link to GitHub
- Better auto-complete suggestions when searching for projects in Jira configuration settings
- Switching the team now preserves the selected working agreement
Automatically link pull requests to investment categories
We continue to invest in automated tools for categorizing work. Now you can link pull requests to investment categories automatically by adding a rule to auto-assign work to categories based on PR titles.
Improvements to the invitation process
Inviting team members to Swarmia is now easier. If they are part of your GitHub organization, they'll be able to log in to Swarmia without an invitation link.
Swarmia is not affected by the Log4j vulnerability
We also wanted to let you know that the recently discovered Apache Log4j Security vulnerability does not affect our services. Swarmia doesn't run Java software on its servers. Nonetheless, we conducted an internal security investigation over the weekend to confirm our systems are operating securely.
Pull request cycle time trendline and breakdown by stage
A software team’s velocity is a combination of many factors. Looking into pull request pipeline by stage is a great starting point to identify bottlenecks and get pull requests through faster. With the new cycle time breakdown it is easy to see whether review, merge, or WIP time takes longer than expected.
You can also use Swarmia’s filters to look at cycle time and throughput metrics for bot-created, cross-team, and other PRs separately.
The chart below cycle time shows how your pull request queue trends over time. When multiple pull requests are left open for long, it trends up. When pull requests are merged timely, it trends down. Many teams will notice that Christmas bump on longer timeframes where cycle time increases during holiday time 🎅.
Pull request age now includes the time since the first commit
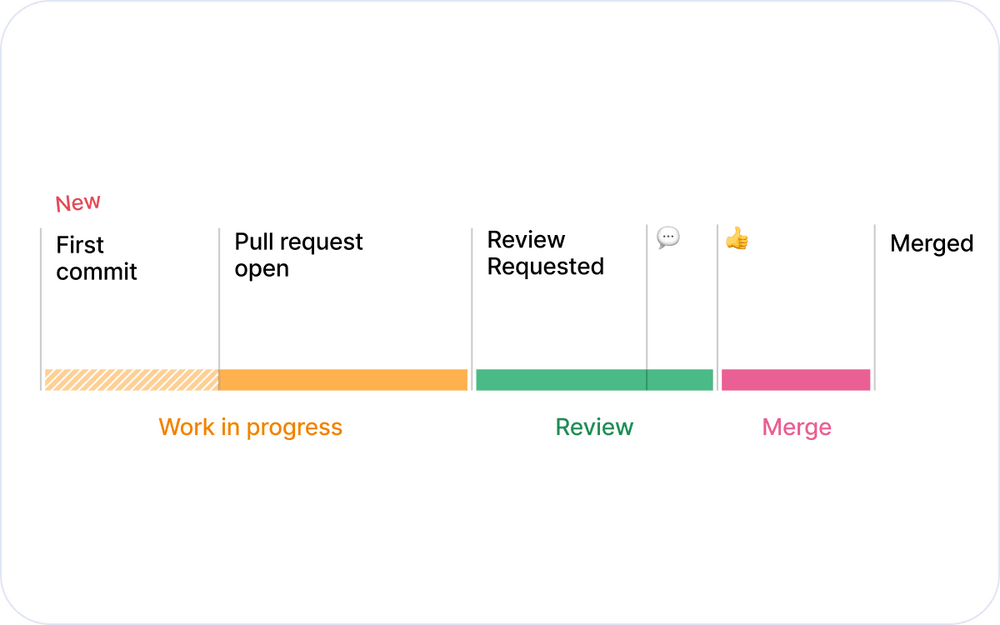
Previously, pull request age was calculated from the moment a pull request was created, and earlier commits would not get reflected in cycle time insights. Including time since the first commit allows better comparison between pull requests and makes pull request insights more accurate.
Other improvements
- Throughput (pull requests merged per day) chart got updated, and now includes the total number of pull requests merged in the selected timeframe in addition to the daily average.
- Cycle time and throughput metrics now include a comparison to the previous time period
High-level Work Log in Swarmia
Our goal at Swarmia is to help teams to get a holistic picture of where their time goes, improve flow and make better planning decisions.
Using Work Log is an excellent way to keep track of day-to-day work and spot patterns like siloing, reactive works, and multi-tasking early on.
With the new high-level Work Log, it’s easy to zoom out and see everything you worked on over the past year. Use it to diagnose flow interruptions, spot never-ending projects, and prepare for team retrospectives.
It’s also a great tool to see just how much you got done and celebrate your progress with the team 🥳.
Working agreement to help you link pull requests to issues
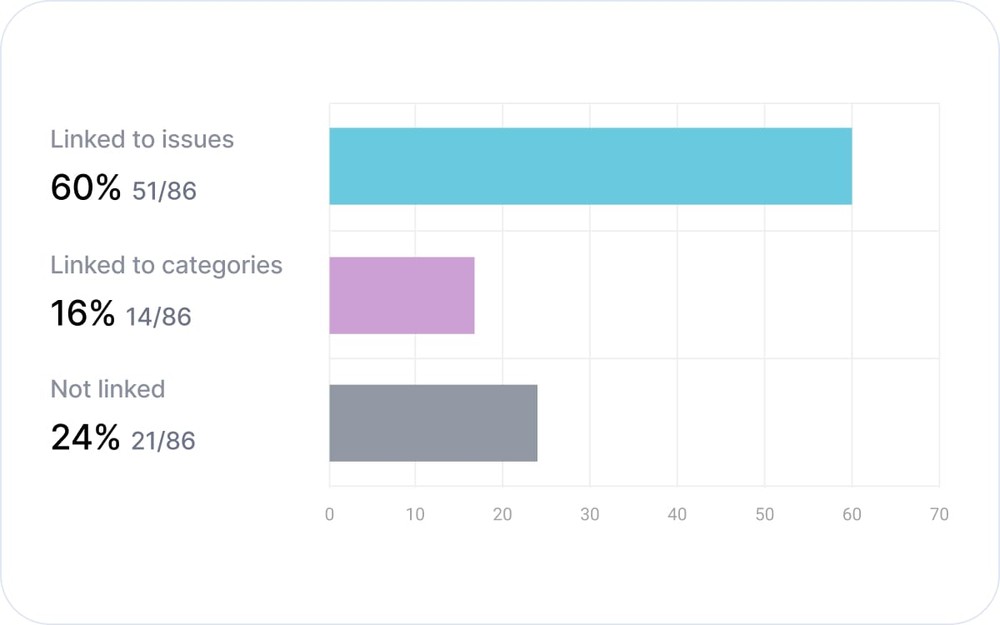
Knowing where the time goes starts with bringing together the data from where work happens. Linking pull requests to issues is a great starting point. It enables better Work Log insights and helps the team to have more informed conversations about how to organize the work.
Add the new working agreement to see how many PRs you link, and don’t forget to enable personal notifications to get timely nudges in Slack when an unlinked PR is merged.
Other improvements
- Now you can see all PRs where you were mentioned in 💬 Participating tab in PR overview
- Fixed an issue where some at-mention notifications would not be delivered
- Stability improvements
Rich previews for personal notifications
Sometimes a PR in review might get a lot of comments, but they're all just observations. Now you can immediately tell from the Slack notification if your PR is good to go or has anything left to improve. Configure personal notifications here.
Don’t miss new comments in PR review threads you respond to
In a well-functioning team, PR reviews move forward fast, and resolving issues highlighted in review is a priority. Now, as you reply to a PR review thread, you will get notified about all new comments until the thread is resolved.
Bot PRs get a new home
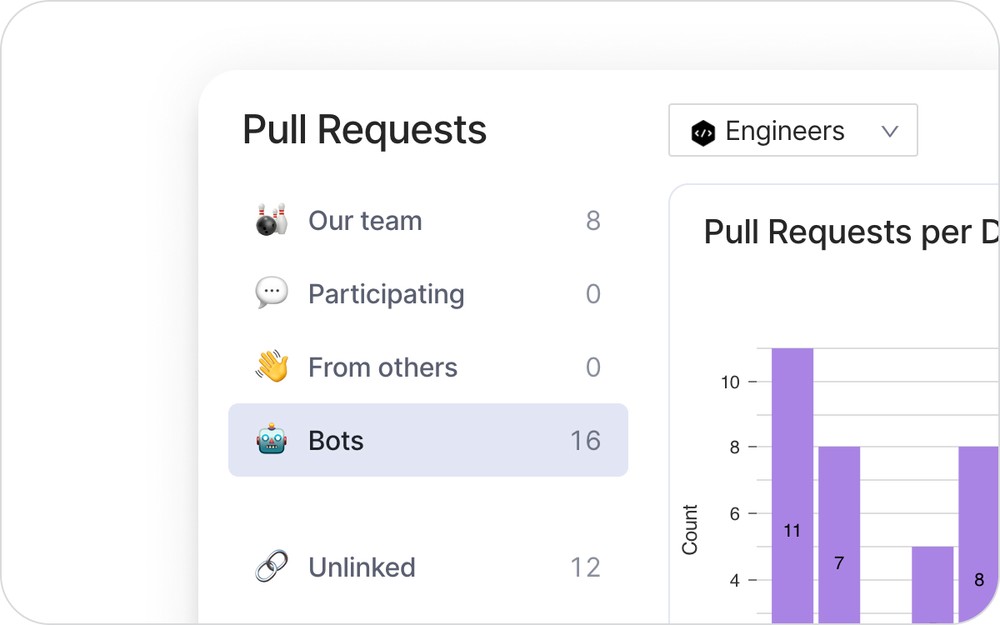
Following up on the latest updates to the PR overview helping you manage your team’s PR inbox, we’ve added a new section for bot-created PRs.
For all bot users in your GitHub organization, you should be able to see their contributions in Swarmia already. You can also assign bots manually in contributor settings.
Other improvements
- Swarmia holds internal security reviews, and a staff security training every six months. Latest review took place in December 2020.
- You can now get Swarmia team updates & daily digest not only in public but also in private Slack channels. Use our guide to get started.
- Now you can see the weekly number of bug fixes in Work Log.
- PRs labeled as bugs now appear in the bugs lane in Work Log even if not linked to an issue.
A better way to manage pull requests
Swarmia continues to build tools that surface the otherwise invisible work in software teams and help you get a clear picture of your pull requests inbox. Now we’re adding new essential filters providing an at-a-glance overview of all pull requests in both personal and team context:
- Unlinked. Pull requests that are not linked to an issue.
- Participating. Pull requests where you are a reviewer, author, or commenter.
- From other teams. Pull requests created by other teams, and assigned to your team to review.
- 24h stale and over 7 days old. Best kept empty.
Soon, bot-created pull requests are getting a new home too. Contact us for more details.
Other improvements
- Fixed an issue where some mentions wouldn’t be delivered via Slack. Another great reason to enable our personal reminders.
- Fixed an issue where some stale pull requests would show up twice in pull request overview.
- Improved error handling across the application.
- Improved organization onboarding.
Predict and prevent exceptions to working agreements
Working agreements are a powerful tool teams use to adopt and keep track of better working habits. Every once in a while, an exception to the rule occurs, and Swarmia already helps you to review those old PRs or a never-ending story that escaped your agreements in the recent past.
Now it’s even easier to prevent future exceptions as you can keep track of all that escapes your agreements ⏰ right now. Aim for inbox zero, and review your agreements with the team frequently to make sure the new habits stick.
Working agreements work best with the daily digest. Once an agreement is adopted, it appears in the digest with a link to all active exceptions.
Improved pull requests overview
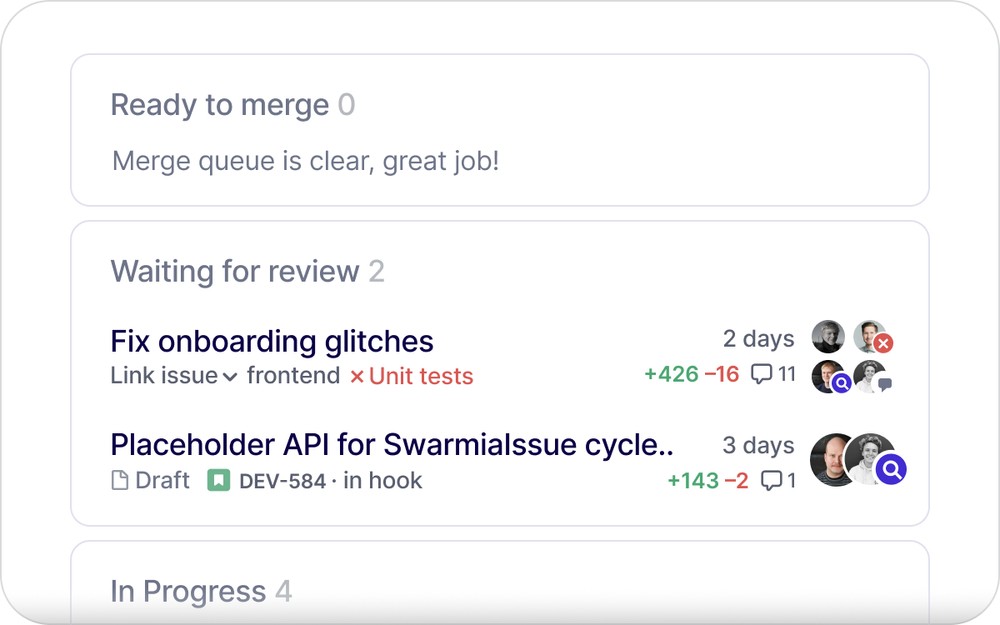
Keeping pull requests inbox in order is the foundation of a healthy software team. With the updated pull requests overview, it's easy to see all work in progress at a glance:
- Pull requests are divided into groups: ready to merge, waiting for review, and in progress. It's clear what action is required next.
- Pull requests with no activity for over 24 hours are labeled Stale. Take care of these first.
- See review status, all contributors (authors, reviewers & commenters), comments, and CI build status for each PR.
This update is part of a series that makes Swarmia your go-to place for everything PR-related. Coming next:
- Filter for stale, old, unlinked pull requests
- All pull requests where you participate (as an author, reviewer or commenter) in one place
- Pull requests from other teams, assigned to your team for review
Share your feedback and suggestions at hello@swarmia.com, or using the chat button anywhere in the app.
Other improvements
- Team selection is now preserved in the URL. Now it's easy to bookmark and share Swarmia pages of the teams you follow.
- Improved handling of commenting bots, more bots are excluded from the pull requests overview + Swarmia notifications
- Now pull requests are labeled Stale in the daily digest only after 24 hours of no activity
- Added support for canceled and archived Linear projects
- Improved accuracy when calculating issue lifetime in the Work Log
Daily Digest update
Making a long-lasting improvement to working habits is impossible without a strong feedback loop. With that in mind, we've built our Daily Digest — a Slack update aligned with your daily stand-up meeting that provides a brief summary of pull requests, issues, and working agreements that need your team's attention, while keeping the noise level to a minimum.
Now it's even more actionable and concise:
- Take action: see pull requests waiting for review & ready for merge
- Draft, in-progress, as well as closed PRs, are not shown
- Stale and Old pull requests are highlighted
- See the number of open vs. completed tasks for issues in progress
Set up your digest in Settings. Make sure to select your team's main Slack channel for better visibility. We're eager to hear your feedback, feel free to send us a message using the chat bubble in the bottom right corner of the app.
Other improvements
- Weekends are now excluded for pull requests marked as Stale in the Daily Digest
- Pull request review time chart now shows the target you have chosen when setting up a new working agreement
- Contributor management improvements
- Improvements to y-axis labels for review time chart
Progress bar for issues with subtasks
See all completed, in progress, and to-do subtasks in a progress bar below each issue in Work Log. Now it easier to stay up to date with the issue scope, and status of subtasks in your projects.
Issue lifetime contributors
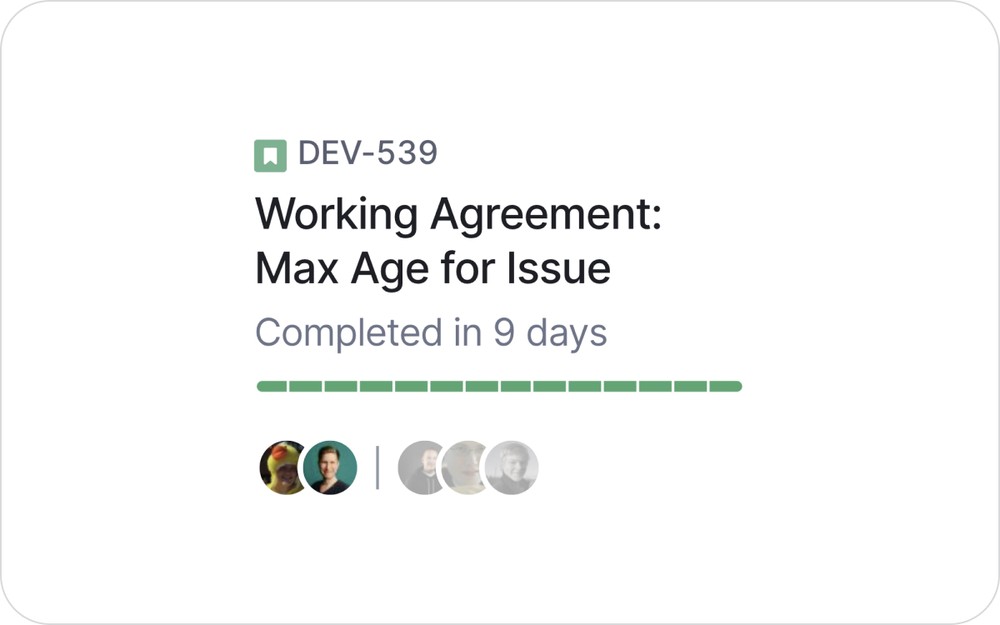
We continue adding improvements to Work Log that give you a broader context to issue activity. Now we show everyone who has worked on an issue over its lifetime, with recent contributors highlighted.
Other improvements
- Working agreements preview now updates live when configuring a new agreement
- Improved error handling, now it is less common for entire pages to fail with an error
- Deleted GitHub teams are not visible in Swarmia anymore, but historical data in all charts is preserved.
- Subtask icons are now shown in the Work Log
- Swarmia Slack bot now posts issue linking confirmation comments to all pull requests
Pull request review time
Swarmia’s Insights already help you keep track of your pull request and issue cycle times, and we also let you set targets for Pull Request cycle time with a Working Agreement. This week, we’re releasing new features that help you drill down to the Pull Request review time, and to set targets for Issue cycle times.
Pull request review time
Making sure that code is reviewed without delay is one of the most important things you can do to improve team dynamics and throughput. Our new Insight and Working Agreement lets teams specifically improve the time it takes to review code. The time to review code is a leading indicator of the pull requests' total cycle time, and counting working days only lets the team set aggressive goals for this crucial step.
A new scatterplot in Pull Request Flow Insights shows how long it takes to provide a review after one is requested. To help organizations dealing with delays caused by cross-team dependencies, reviews provided by other teams are highlighted in a different color.
The corresponding Working Agreement helps your team step up your Pull Request review game by setting a target for how many working days Pull Requests wait for review.
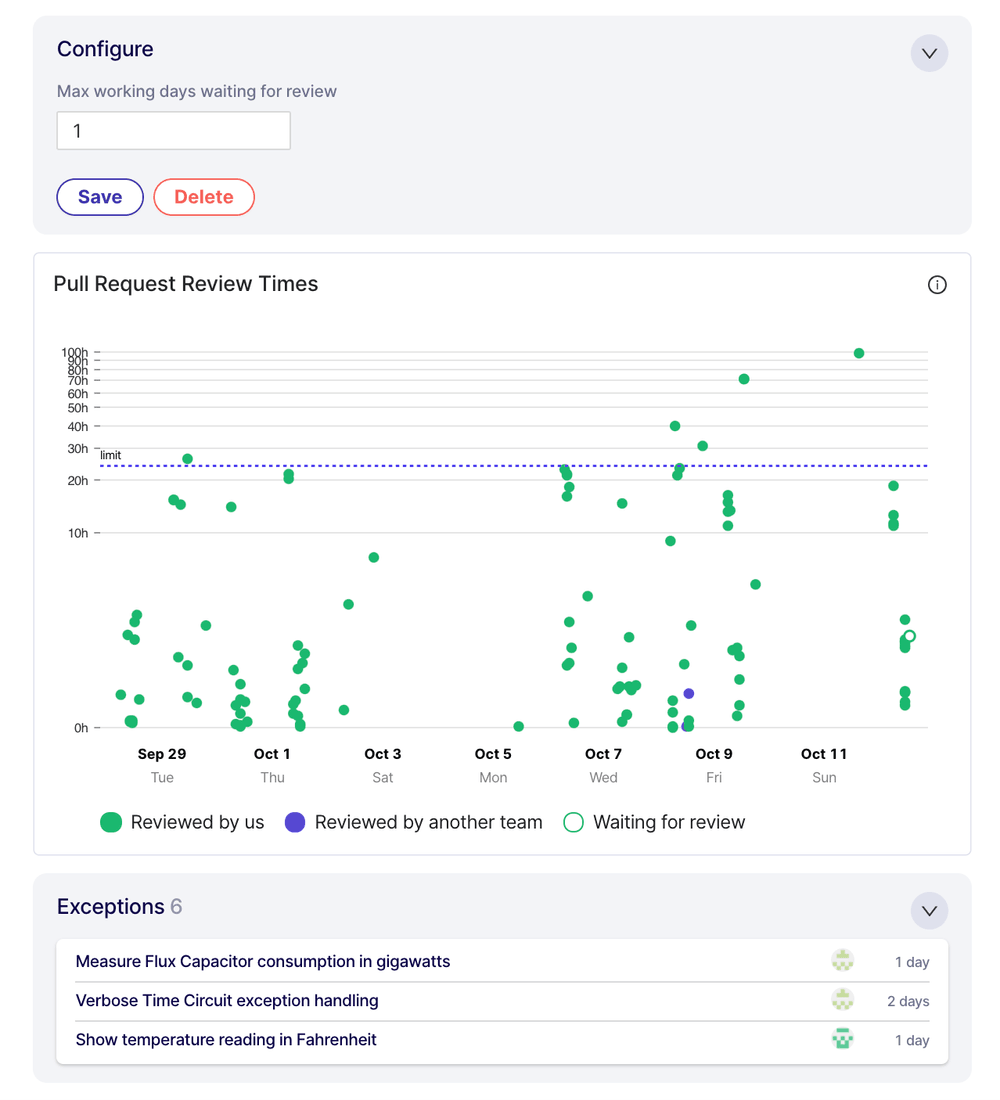
As with other Working Agreements, details about exceptions help your team troubleshoot your process in retrospective meetings, and instant feedback in the daily Slack digest helps you address issues with Pull Requests reviews as they occur.
You can read more about why and how to review code faster in our Support Article.
Manage issue cycle time
Most teams have a rough idea of how long it should take to finish an Epic, Story or Task, but it’s common for progress on Issues to stall for a multitude of reasons. Our new Working Agreement helps teams manage cycle time by setting targets in calendar days and highlighting exceptions.
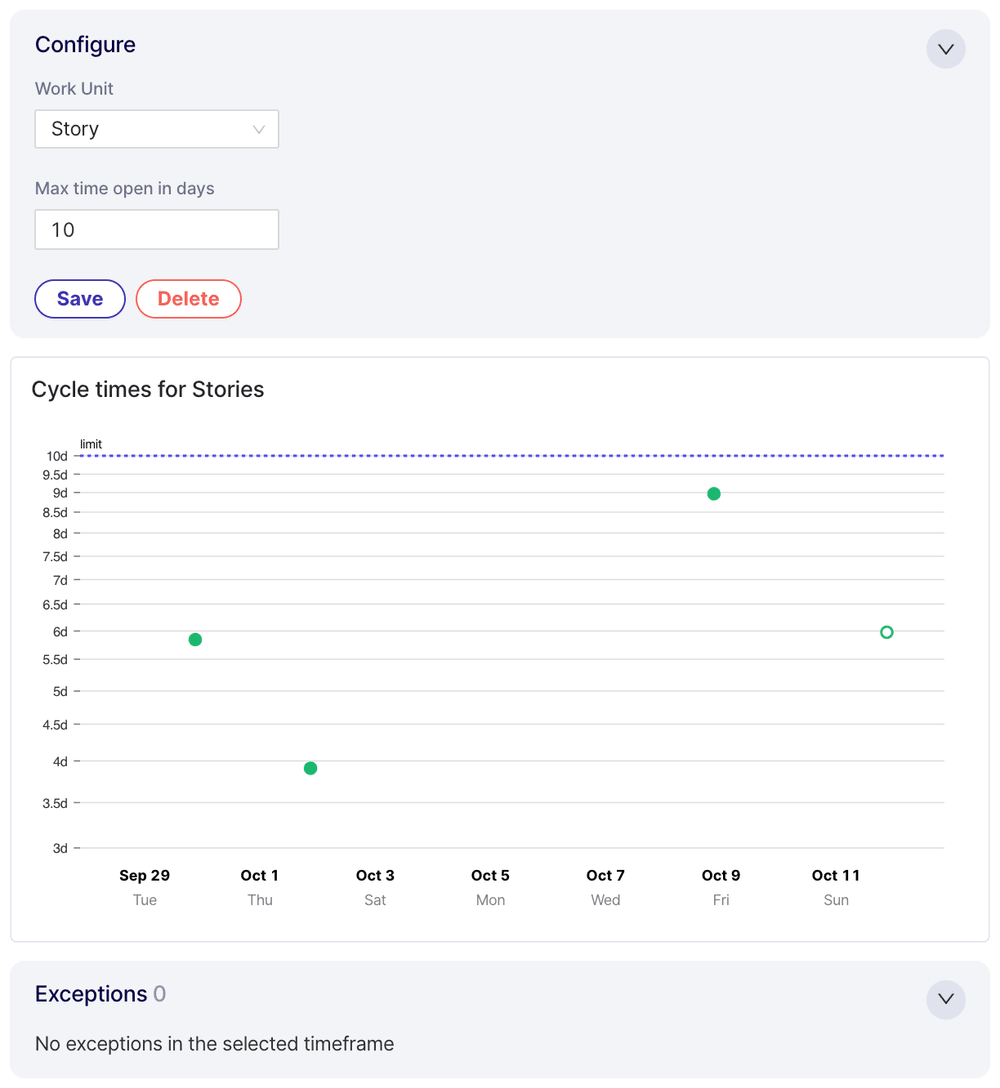
In addition to the Working Agreement page and the daily Slack digest, issues that are taking too long are highlighted in Work Log to help teams analyze exceptions in context.
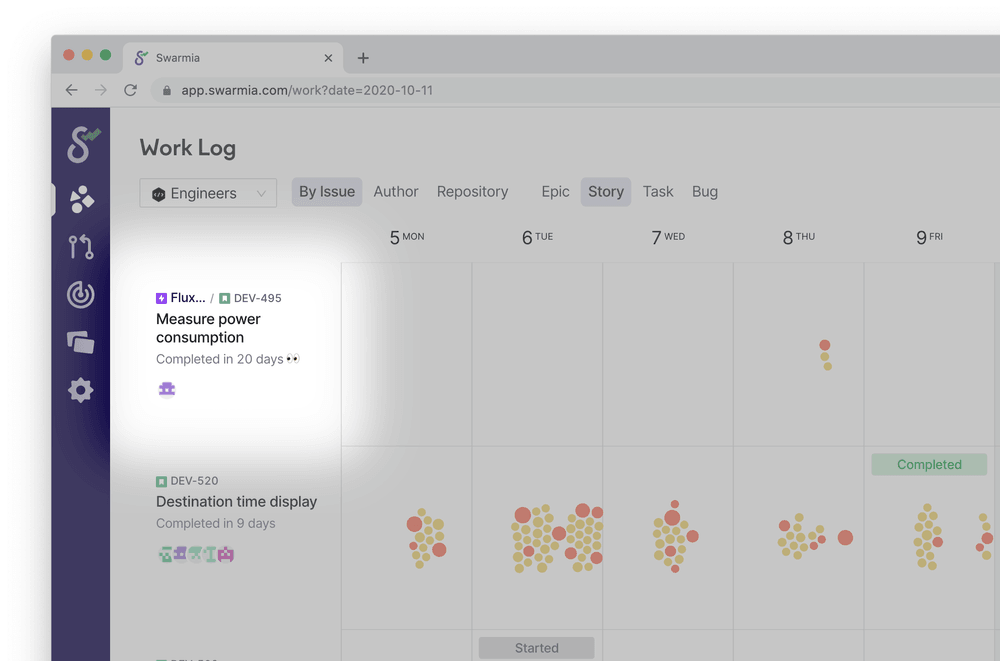
Other improvements
- In addition to Work Log, the Issue Activity popup can now be opened by clicking an issue in Flow Insights
- Improvements to Insights visualizations, including separately showing the median
- Small fixes to how Pull Request categories are displayed in Work Log
Updates to Working Agreements
Swarmia’s Working Agreements have already been helping teams when it comes to managing work in progress and cycle time. Many teams have found them especially useful to manage issue workload, and to get notified when issues are taking too long. However, a limitation so far has been the ability to only create working agreements about one issue type.
Add Another Working Agreement
Managing the amount of work in progress is one of the most effective ways for a team to maintain focus and deliver tasks quickly. Imposing work-in-progress limits for Stories has been an important tool for teams struggling with too much work, but this has precluded setting similar limits for Epics, Tasks, or Bugs. At the same time, most teams have an idea about how long different tasks should take. For example, Stories should usually be completed within a week or two, whereas Tasks can be significantly shorter, and Epics significantly longer.
Swarmia now allows teams to adopt multiple copies of issue related Working Agreements. For example, teams can impose work-in-progress limits for both Stories and Epics, and also manage the cycle times of both issue types. If you’ve already adopted Working Agreements about the number of Stories open at once, or targets for closing Stories, navigate to theExplore tab in Working Agreements, select either working agreement, create a new configuration, and click Adopt another.
In this case, a team that has already agreed to have a maximum of three Stories open at once can adopt another Working Agreement, this time limiting the number of Epics open at once to one. Adopting multiple, identical Working Agreements is of course not supported or useful. Adding multiple copies of Pull Request related Working Agreements is also not supported.
Pull Request Review Distribution
Our new Insights about Pull Request review times have been useful for teams with delays in this crucial step. Most teams are mostly alright in terms of review times, with significant outliers causing problems. To help teams understand the magnitude of issues with Pull Request review, we’ve added a new histogram that shows the distribution of review times, and we also now spell out the median review times separately for all issues, issues reviewed by the team itself, and issues reviewed by other teams.
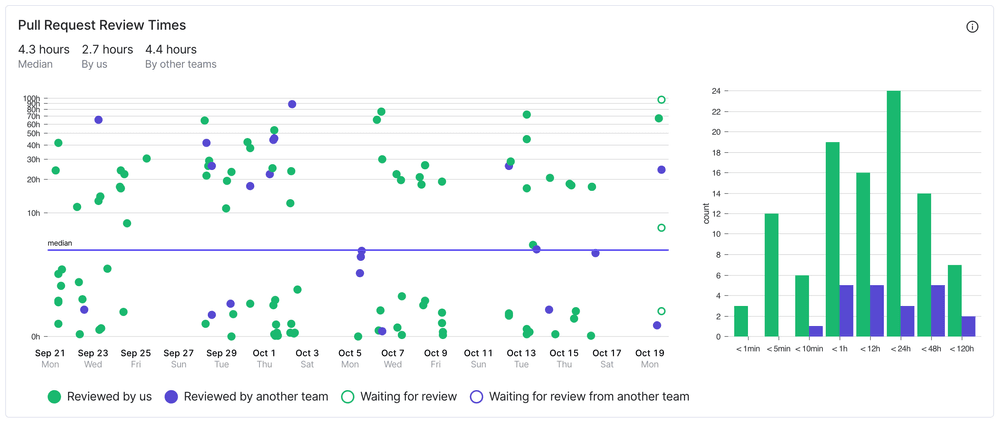
Other improvements
- Small UI improvements to charts in Working Agreements
- Tooltips in Pull Request Insights show contributor avatars and review conclusion
- Charts in Working Agreements show the limit line instead of the median
- Small fixes to how we calculate unplanned work in Work Log
Pull request categories
Linking pull requests to issues from your issue tracker is the best way to keep tabs on your team’s focus and flow using Work Log. But when teams self-organize around caring for a codebase, it’s just natural that not all pull requests can be linked to an issue.
Pull request categories
It’s great when teams take ownership of their code and deal with small bugs, chores and improvements right away, but it’s still useful to understand where the team’s efforts are spent. This week we’re introducing a powerful new feature to categorize Pull Requests without linking them to issues.
Previously, all unlinked Pull Requests were plotted on the Uncategorized row in Work Log, with no quick way to identify what kind of work it was. The new Pull Request Categories feature lets you assign unlinked pull requests to one of four categories: Bug, Improvement, Chore, or Refactoring.
Unlinked Pull Requests can be assigned to a category by selecting it in the familiar dropdown menu in the Pull Request view.
As usual, we notify you on Slack when merging an unlinked Pull Request. Now you have the option to click a button labeled "It’s something else" and select a category:
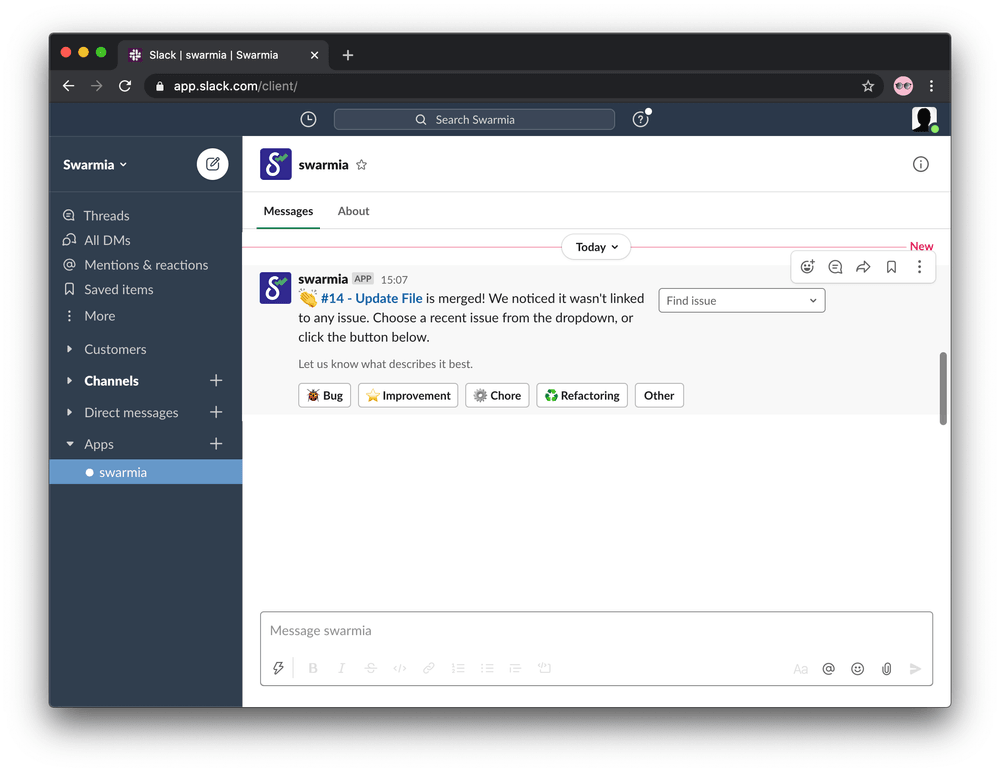
As a result, Work Log shows a much more accurate view of where the team spends its focus. Unlinked Pull Requests assigned to the Bug category are plotted right on the Bugs swimlane, and the newly renamed Unplanned swimlane shows a breakdown of the week’s unlinked Pull Requests by category.
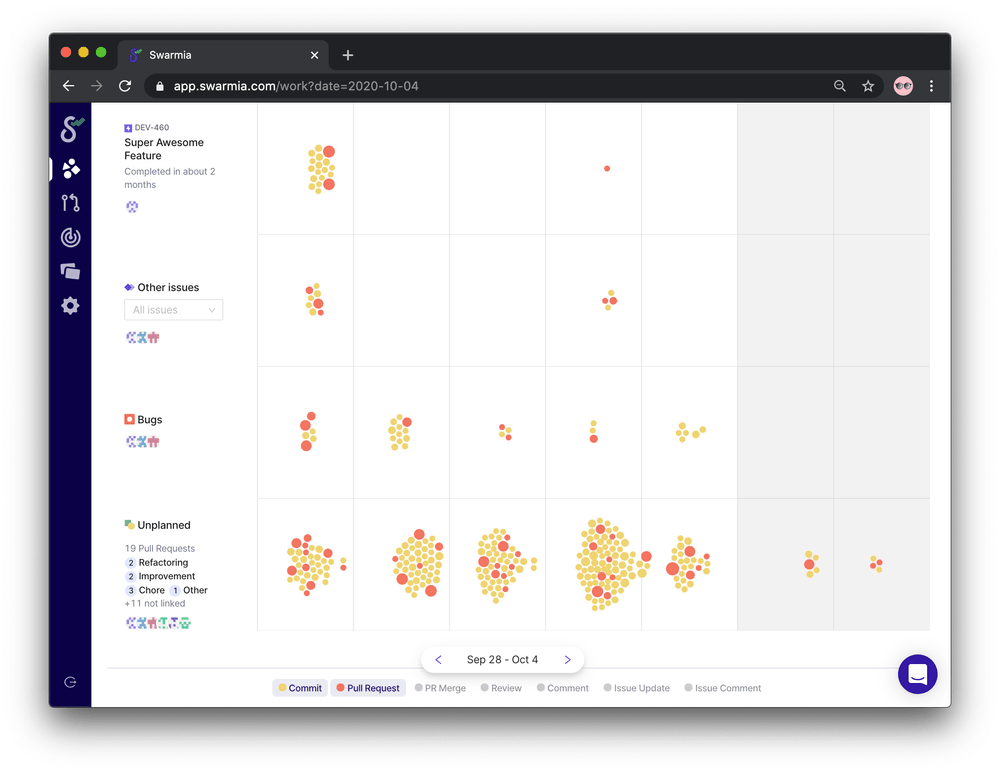
Other improvements
- Fixes to calendar rendering in Issue Insights when an issue has been open for a very long time
- Stopped sending Slack messages about edited pull request comments
- Fixed small issues with handling GitHub Check Runs
- Performance improvements to Continuous Integration Insights
- Pull Request comment about issue linking now shows the full issue hierarchy
Issue insights
Work Log already helps you visualize where your team’s focus is spent on a weekly basis and to identify common patterns having to do with team dynamics and focus. The all-new Issue Insights feature lets you drill down deeper on an individual Epic, Story, Task or Bug to find out how your team organizes around issues, and what you could do to increase focus and accelerate delivery.
Drill down on issue flow
Navigate to Work Log and click on an issue. This opens the Issue Insights popup that shows a number of key facts.
Open days is the number of calendar days since the first linked GitHub activity, or since the issue was marked In Progress. Active days is the total number of days with activity linked to the issue. Efficiency is the ratio of Active days to business days.
The calendar shows the intensity of activity linked to the issue per day: the darker the shade of blue, the more activity on that day. To take a closer look at what your team was working on in a given week, clicking a week in the calendar takes you to that week in Work Log.
Focus matters
Ideally, we want to see long streaks of dark blue in the calendar. Teams that put in big chunks of focused work tend to finish fast, even if efficiency is under 100% — short interruptions like vacation days and urgent bugs are hard to avoid completely.
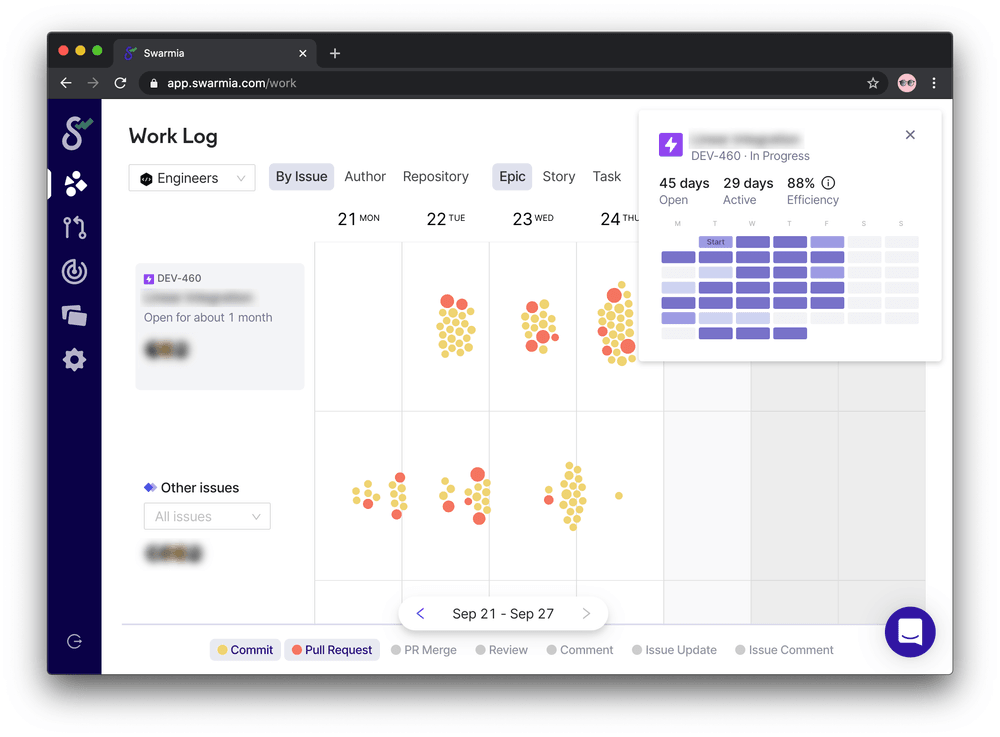
Often the reality is that team focus is stretched too thin. Even with 100% efficiency, progress can be slower than necessary if contributors are working alone or there are many concurrent topics competing for the team’s attention. This is evident in the issue insights calendar when progress is steady, but most days are a lighter shade of blue.
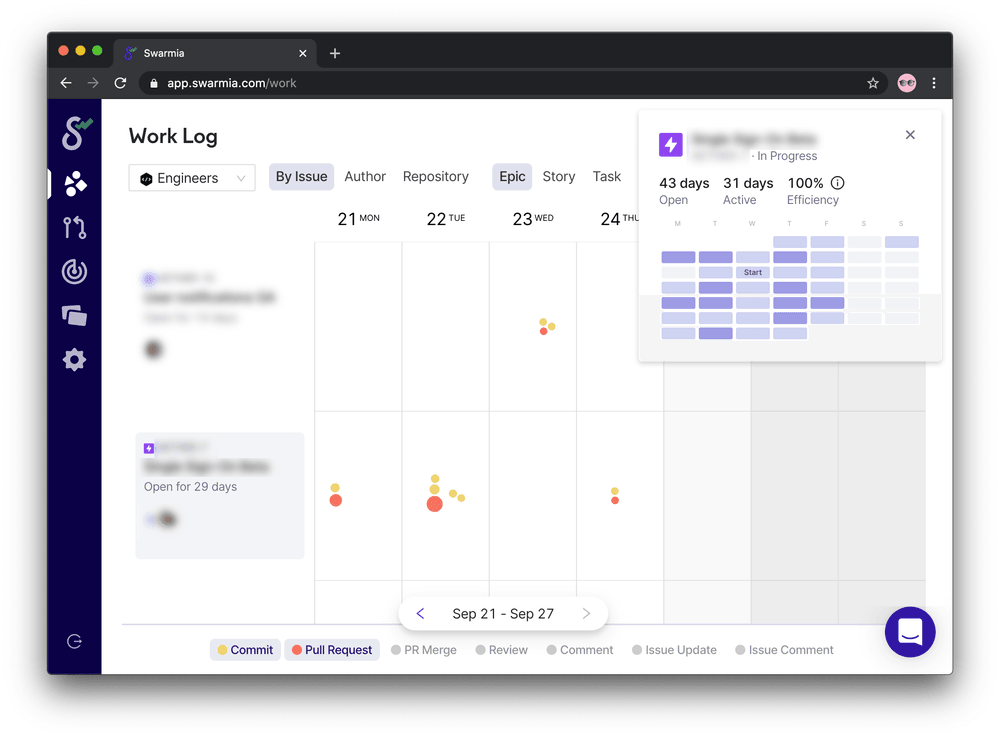
Unfortunately, it’s all too common for teams to be inundated with work in progress and constant interruptions. Slow progress with lots of waiting is clearly visible in the issue insights calendar with long periods of grey inactivity interspersed by light-blue days here and there.
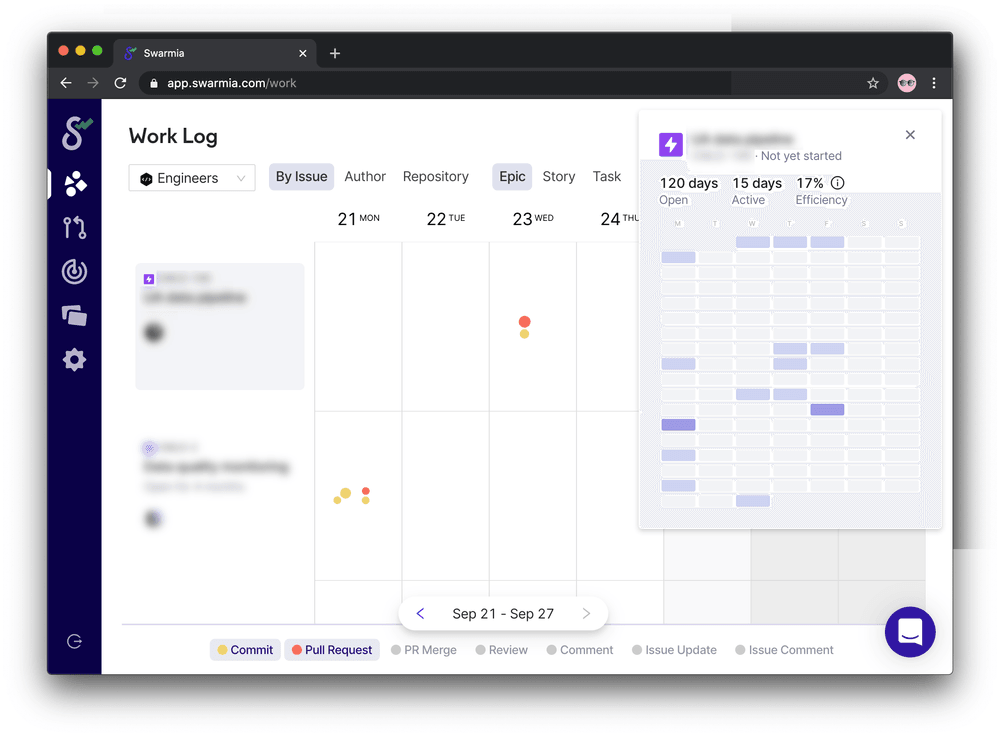
How is your team doing? Head over to{' '} Work Log and click on some issues to find out!
Issue link in pull request comments
To get the full benefits of Swarmia’s Work Log and the new Issue Insights, it’s important to get into the habit of linking Pull Requests to Jira issues. Swarmia now posts a comment in each linked Pull Request to confirm that it’s been linked, as well as to help you quickly check the respective Jira issue for scope, designs and other context by following the link in the comment.
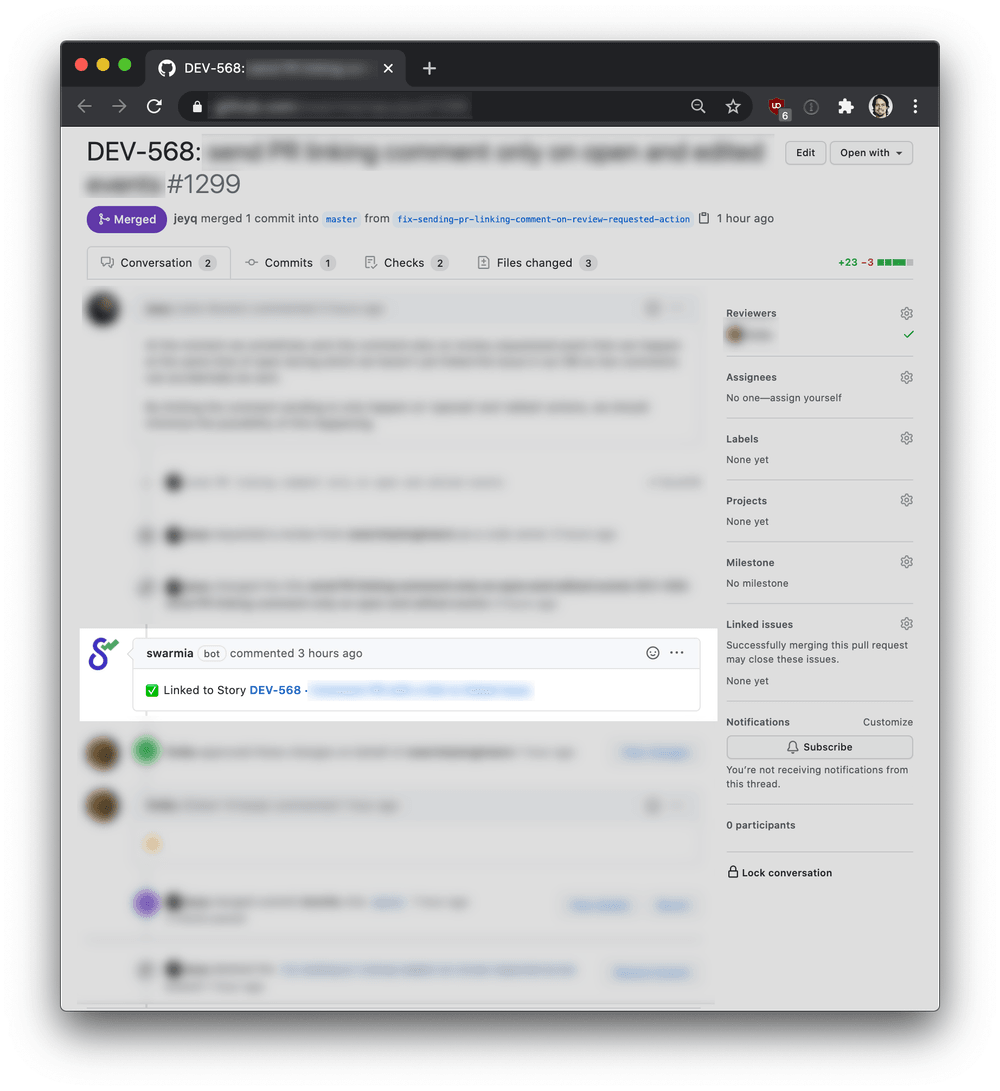
New issue tracker: Linear
In addition to Jira, most Swarmia features are available now for Linear users as well. Link Pull Requests, view Work Log by Linear project or issue, and view Insights about Linear projects and issues. Let us know if you’re using Linear and would like to look beyond pull requests with Swarmia!
Small improvements
- Lots of small optimizations amounting to a significant performance boost
- Cycle time metric now includes merged pull requests only
- Slack notifications are sent about @mentions in GitHub comments
- Lots of small UI tweaks and bugfixes to improve usability
Introducing Working Agreements
We believe in self-organizing teams that own their ways of working. With Swarmia, teams already get full visibility into their process and can identify potential improvements — but transparency alone is not enough to become better and stronger as a team. Working Agreements is a powerful new feature that helps teams continuously improve with clear goals and consistent execution. Our first iteration includes features to manage the amount of work in progress and the cycle time of Pull Requests.
Manage Work in Progress and Cycle Time
Managing the amount of work in progress and reviewing code without delay are some of the best ways for teams to improve their speed and focus. Our first Working Agreements allow teams to set work-in-progress limits for issues and Pull Requests, and to set a limit for Pull Request age.
Ready to jump in? Why not have a conversation with your team and head over to the new Working Agreements area in the app to get started.
Working Agreements are simple to configure and adopt, and insights about the Working Agreement as well as details about recent exceptions are clearly visible in the UI.
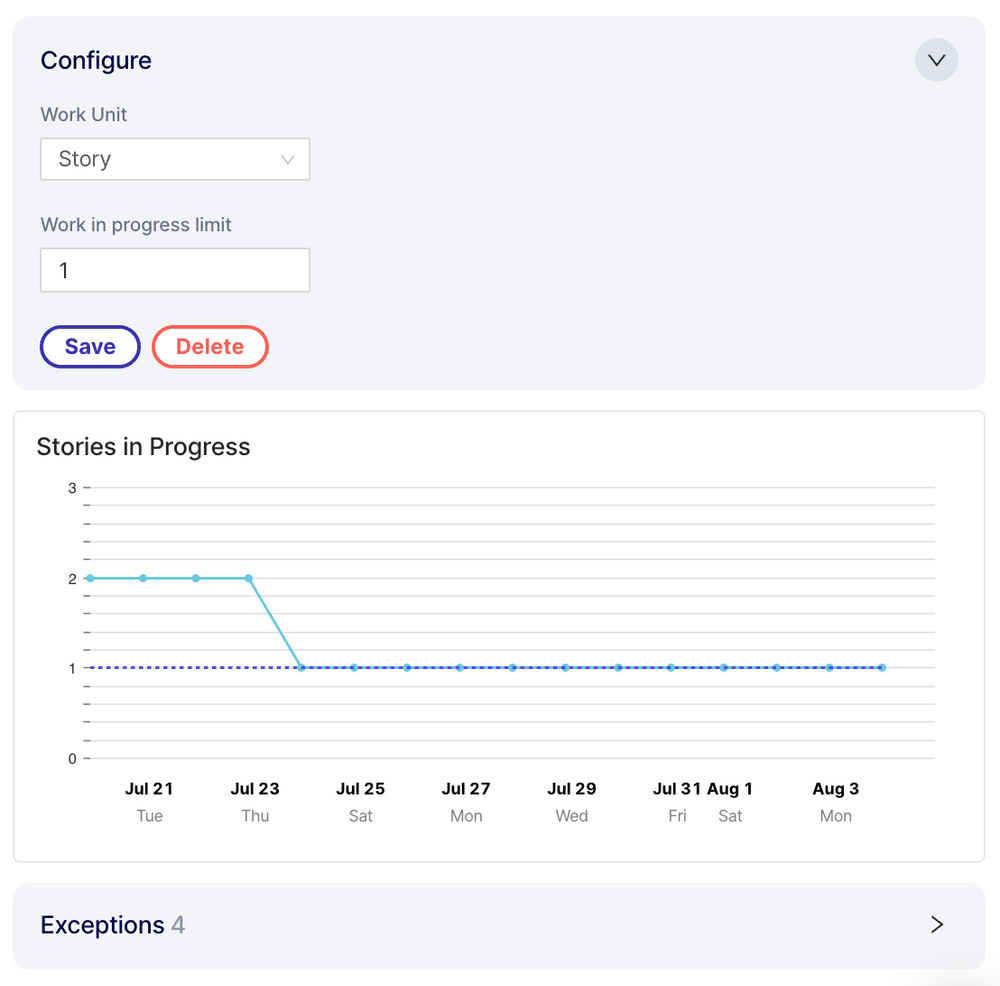
Finally, the daily Slack notification shows how the team is doing with their Working Agreements, helping teams adopt new habits with immediate feedback. If you haven't enabled Slack notifications for your team yet, now is a good time to do it.
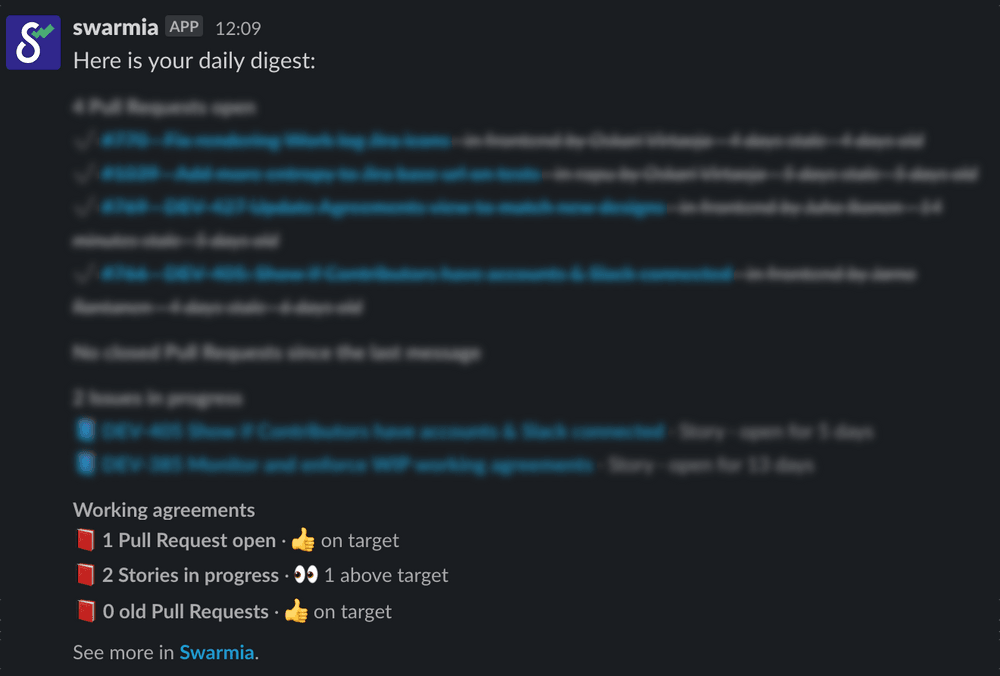
What Working Agreements does your team use, or would find useful? We have lots of ideas about what to do next, but we'd like to hear from you.
Other improvements
- Cycle Time graph in the Pull Requests view updated to scatterplot
- Continuing to adopt our new design in frontend
- Performance improvements
New flow insights: cycle time
As mentioned in the previous feature update, managing the amount of work in progress is a great way to get work done faster.
New cycle time insights plots completed issues on a timeline and shows how long they were open. The scatter plot makes it easy to identify outliers and trends, and drill down on individual issues.
Can you find correlations between the amount of work in progress and cycle time for your team?
Other improvements
- Significant Work Log performance boost
- Usability improvements to tooltips in Insights
- Improved color palette for data visualizations
- Numerous small usability and UI improvements
Quality insights
We continue to work on the Insights product area. This week we are adding Quality Insights to help teams stay on top of their Continuous Integration pipelines, and working on all new Insights about flow.
Quality insights: build time
In addition to flaky builds, Continuous Integration Insights has a new tab that plots build times on a timeline. Drill down to a given day to see the average build runtimes and the number of builds.
Coming soon: Controlling the amount of unfinished work is a great way to stay focused and improve flow. Find out next week how we can help teams locate bottlenecks and understand how much work they have on their plate!
Other improvements
- Small usability improvements in Work Log
- Improved database and app performance
- UI tweaks and small bugfixes to Quality Insights
- Usability improvements in Team and GitHub Settings
New flow insights: work in progress
Managing the amount of work in progress is one of the best ways for a team to improve focus and get work done faster.
Flow Insights plots the number of open Pull Requests, Epics, Stories and Tasks on a timeline, helping teams understand how much work they have on their plate at a given time.
Lots of Work in Progress usually correlates with longer cycle time and intermittent progress, which is something you can identify in Work Log. What correlations can you find?
Other improvements
- Usability improvements/fixes in personal and Slack settings
- Improvements and bugfixes to Insights charts and tooltips
Insights
We're starting to develop a new product area called Insights to help teams form a holistic view of their ways of working. The first Insights are about quality: bugs and continuous integration.
Introducing quality insights
Bug Insights shows the volume of bugs on a timeline and how many bugs you are opening and closing on a daily basis, based on your team's Jira data.
Continuous Integration Insights plots the daily percentage of flaky builds on a timeline. You can drill down to a given day to see how many builds were flaky and how much time was wasted waiting for them to complete.
Next up: build duration. Stay tuned, and don't forget to let us know what you think!
Other improvements
- Work Log shows all issues that your team has worked on even if they are assigned to other teams
- Work Log shows both Tasks and Stories under Other Issues in Epic view
- Usability improvements in Jira Settings for larger organizations

